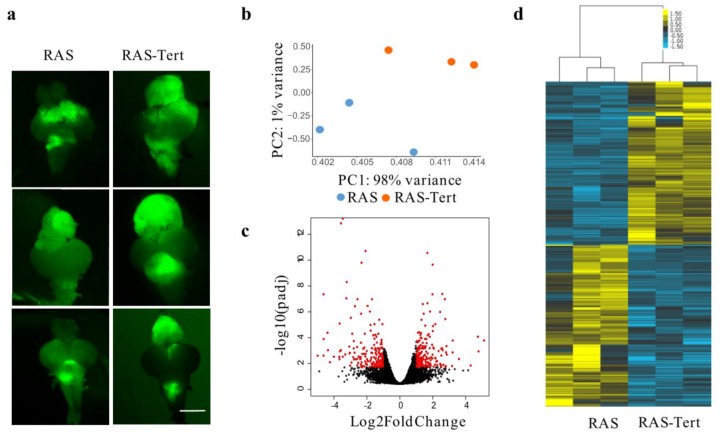
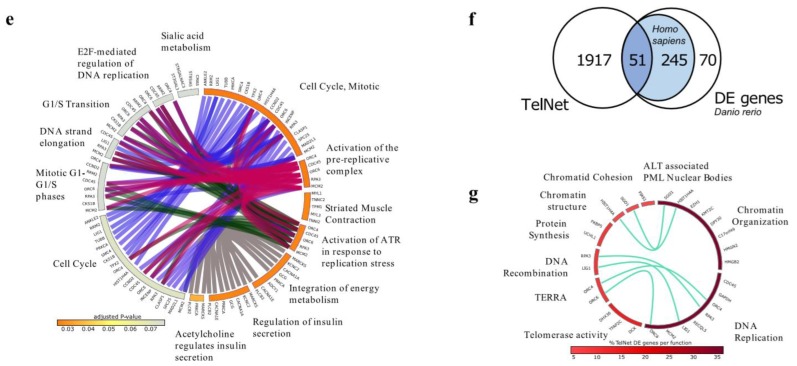
Figure 1.
Analysis of RNA-Seq showed a class of genes altered in zebrafish brain tumors with different TMMs. (a) Images showing zebrafish RAS and RAS-Tert brains used for the RNA-Seq analysis. The expression of eGFP-HRASV12 was induced in a population of brain progenitor cells using the driver line zic:GAL4 [16]. The tumour masses in 1-month old fish are visualised through eGFP expression. Scale bar: 0.5 mm. (b) Principal component analysis (PCA) of the gene expression counts (Trimmed Mean of M-values, TMM) showing the first versus the second principal component (PC). Samples in the two conditions are highlighted in different colors. (c) Volcano plot representing −log10 Benjamini-Hochberg (BH) adjusted p-value and log2 Fold Change of genes in the comparison RAS and RAS-TERT. In red differentially expressed genes with adjusted p-value < 0.05 and log2 Fold Change >1 or <−1 are highlighted. (d) Heatmap showing the 366 differentially expressed genes between brain tumors from RAS and RAS-Tert, hierarchically clustered with average linkage and uncentered correlation metric with cluster3, and displayed with tree view. (e) Circular bar representing Reactome pathways enrichment for the DE gene set, colored according to adjusted p-value, with the most significant in orange, drawn with circos. DE genes in the pathways are indicated on the bars and are connected to the same genes in other pathways. (f) Venn diagram showing the number of differentially expressed genes between RAS and RAS-Tert brain tumors, which have a human ortholog and are present in TelNet database. (g) Circular plot depicting TelNet functions of the differentially expressed genes reported in TelNet database and their connections.


