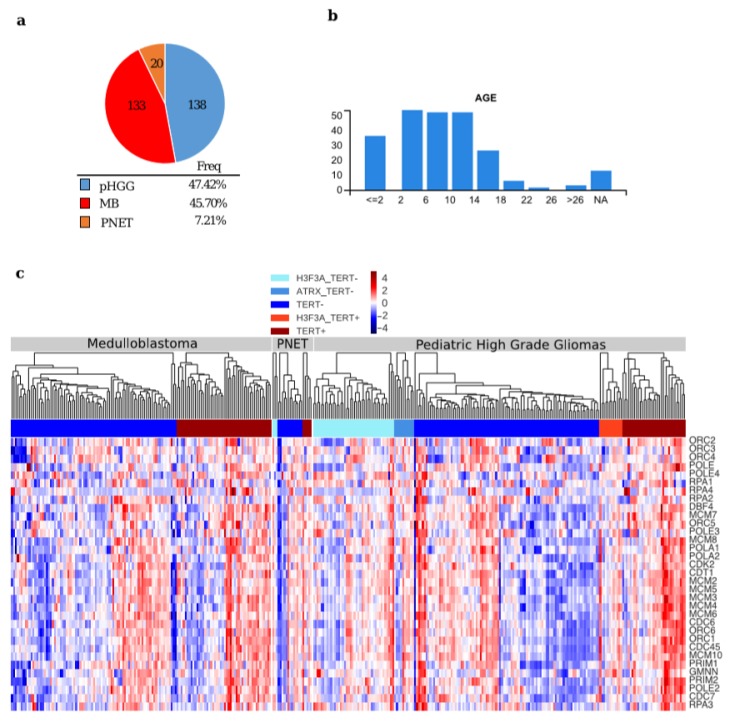
Figure 2.
General features in paediatric brain tumor samples used for comparison (a) Pie chart depicting the tumor samples from the pediatric cBio Portal used in the analysis; (b) Diagrams showing the different ages of the patients from the pediatric cBio Portal; (c) Hierarchical clustering of the expression values of the genes of the Reactome pathway: “Activation of the pre-replicative complex” (Homo sapiens R-HSA-68962) in samples from the paediatric cBio Portal. The samples were divided per tumor type, according to the presence of mutations in H3F3A and/or ATRX, and TERT expression level (TERT+: Z-score > 0, TERT−: Z-score < 0).

