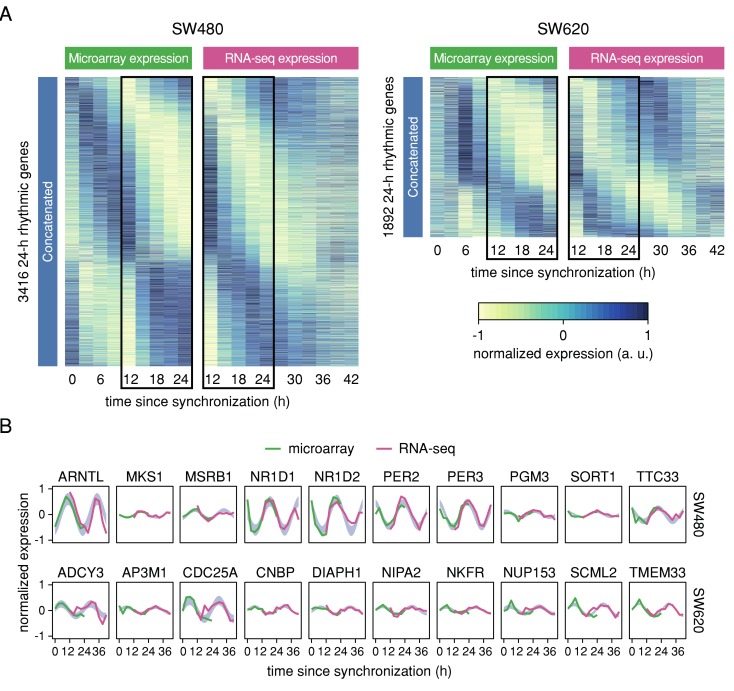
Figure 3.
Concatenation of samples from circadian microarray and RNA-seq datasets reveals robustly 24-h rhythmic genes across platforms. (A) Range-normalized, phase-ordered microarray (respective left panel) and RNA-seq expression (respective right panel) heatmaps of genes that were identified as 24-h rhythmic in SW480 cells (two leftmost panels) and SW620 cells (two rightmost panels) in the concatenated data. Each row represents one gene. Phases were estimated based on the concatenated data. Black rectangles mark the shared time points between the microarray and the RNA-seq data. (B) Normalized time-series expression of the top ten 24 h rhythmic genes identified in SW480 cells (top row) and SW620 cells (bottom row) based on the concatenated data. Microarray expression values are represented by green lines and RNA-seq expression values by pink lines. The blue area marks the confidence area of the harmonic regression fitted to the concatenated data for 24-h rhythmic genes.

