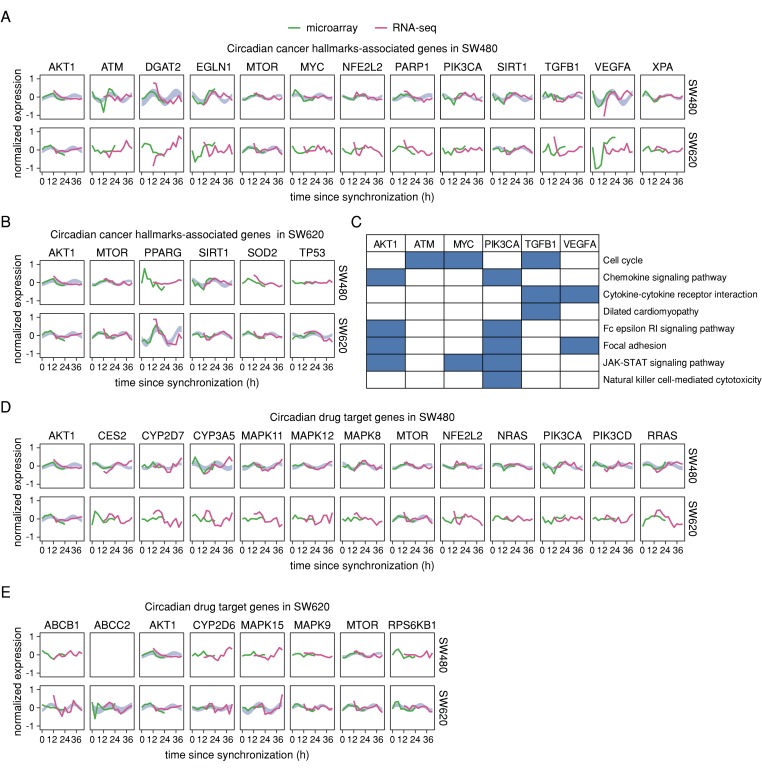
Figure 5.
Cancer hallmark-associated and drug target genes show differing oscillatory expression in SW480 and SW620 cells. Normalized time series expression of cancer hallmark-associated genes identified as 24 h rhythmic in (A) SW480 and (B) SW620 cells based on the concatenated data. (C) Phase-clustered circadian KEGG pathways in which cancer hallmark-associated genes are involved in SW480 cells. Normalized time series expression of drug target genes identified as 24 h rhythmic in (D) SW480 and (E) SW620 cells based on the concatenated data. Microarray expression values are represented by green lines and RNA-seq expression values by pink lines. The respective top row shows the expression in SW480 cells and the respective bottom row in SW620 cells. The blue area marks the confidence area of the harmonic regression fitted to the concatenated data for 24 h rhythmic genes.

