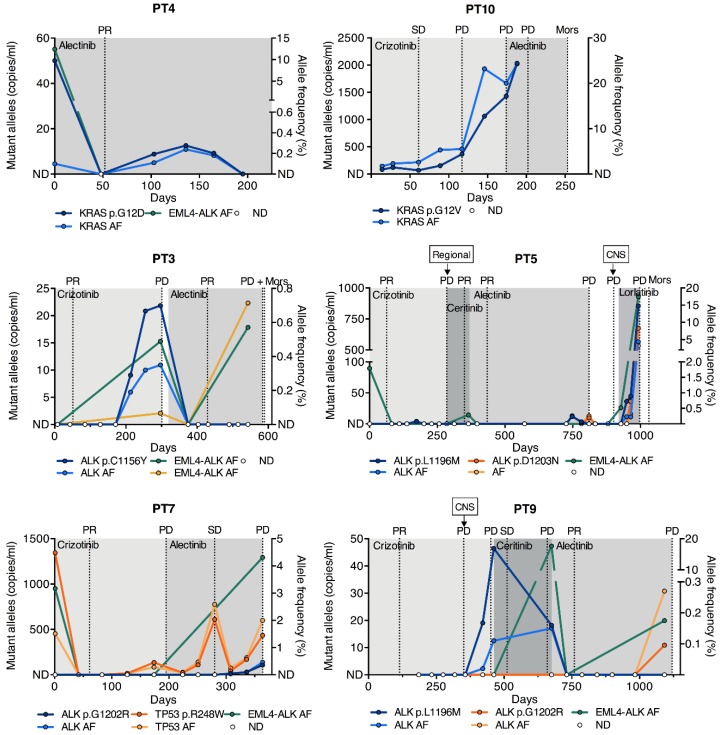
Figure 4.
Longitudinal measurements of SNVs. Longitudinal monitoring of SNVs in six patients with ALK, KRAS, and TP53 mutations by ddPCR during ALK TKI treatment. The x-axis indicates the time from the start of the treatment in days. The left y-axis indicates the mutant allele concentration of the SNV in copies/mL plasma, and the right y-axis shows the AF in percent. EML4-ALK rearrangement AFs from NGS analysis are plotted as well. Representative CT scan evaluations are indicated by gridlines, and ALK TKI treatments by shaded areas. PR, partial response; SD, stable disease; Mors, deceased; AF, allele frequency; ND, not detected; CNS, central nervous system; ddPCR, droplet digital PCR.

