
FIGURE 1.
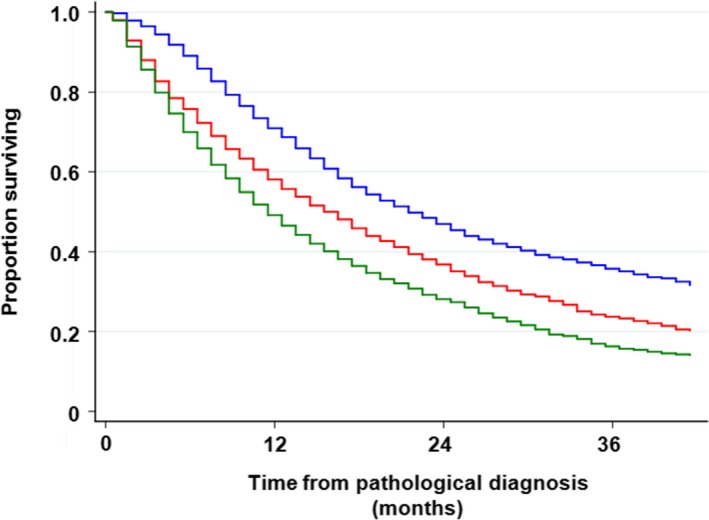
Overall survival rate with regard to clinical M stage. Patients with M1a disease had a significantly better survival rate than those with M1b disease. The 3‐y survival rate was 23.3% vs 15.7%, respectively (P < .001). Blue line, M0; red line, M1a; and dark green line, M1b