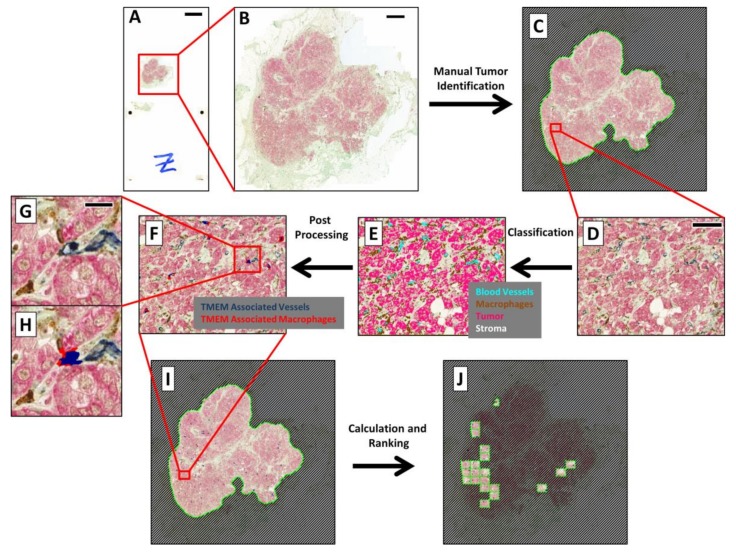
Figure 1.
Algorithm for performing automated Tumor MicroEnvironment of Metastasis (TMEM) doorway analysis and scoring on whole scanned slides: Automated identification of TMEM doorway in immunohistochemical(IHC)-stained slides requires several steps applied at different magnifications. (A) Digitized whole slide captured on the 3DHistech Pannoramic P250 slide scanner. Bar = 5000 µm. (B) Zoomed-in region of just the tissue. Bar = 1000 µm. (C) Pathologist identification of invasive tumor by drawing a region of interest (ROI) separating and masking off the tumor tissue from the surrounding stroma. (D) A 40× equivalent zoomed-in field-of-view within the tumor area. Bar = 100 µm. (E) Classification of each pixel as either a blood vessel (cyan), a macrophage (brown), a tumor cell (pink), or stroma (uncolored). (F) Identification of TMEM doorways highlights the TMEM-associated vessels in dark blue and the TMEM-associated macrophages in red. (G) Zoomed-in view of one identified TMEM doorway from Figure 1F. Bar = 20 µm. (H) Same as Figure 1G with the overlay indicating the TMEM-associated vessel (dark blue) and TMEM-associated macrophage (red). (I) Image of the whole tissue after application of both the tumor identification and TMEM identification algorithms. (J) The top 10 scoring fields are highlighted by the TMEM ranking algorithm.

