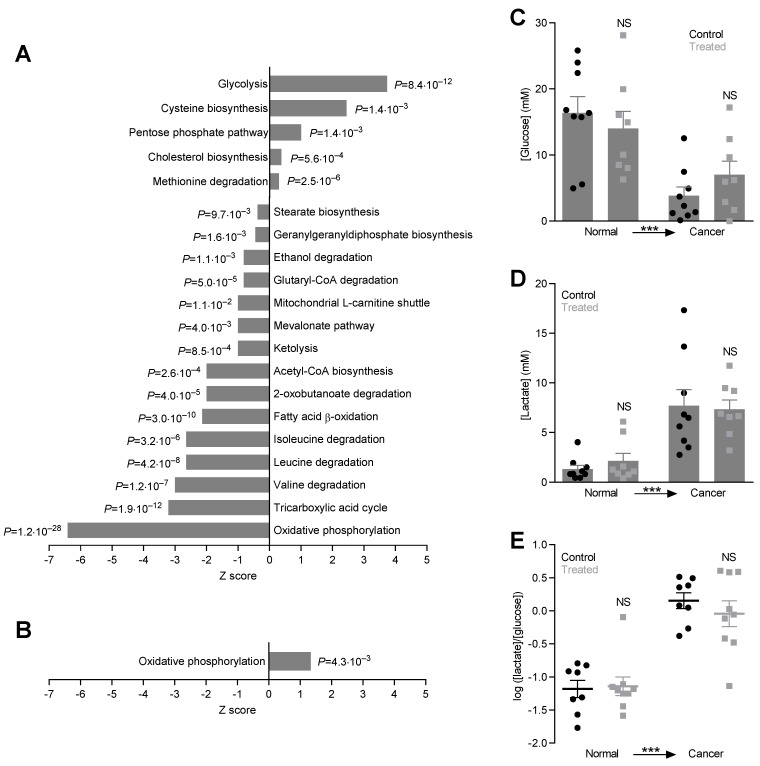
Figure 3.
Metabolic pathways are dramatically perturbed during breast carcinogenesis but glycolytic metabolism in breast cancer tissue and normal breast tissue in vivo is unaffected by oral NaHCO3 therapy. (A, B). Protein expression changes for metabolic pathways. We compare breast cancer tissue vs. normal breast tissue from control mice (A) and breast cancer tissue from NaHCO3-treated mice vs. control mice (B). p-values were calculated based on Fisher’s right-tailed exact test. (C–E). Interstitial concentrations of glucose (C) and lactate (D) and corresponding [glucose]/[lactate]-ratios (E) measured in microdialysis samples from breast cancer tissue and matched normal breast tissue of NaHCO3-treated mice and control mice (n = 8–9). Data were compared by repeated measures to-way ANOVA followed by Sidak’s post-tests. NS: not significantly different vs. Control. ***p < 0.001.

