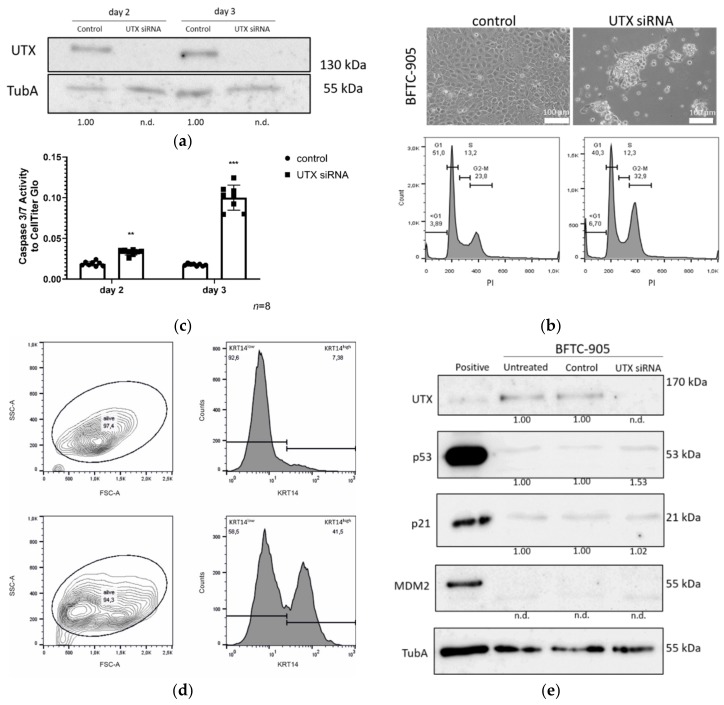
Figure 9.
Effects of UTX knockdown on BFTC-905 urothelial carcinoma cells. (a) Efficient knockdown of UTX protein shown by Western blot analysis. (b) Changes in morphology, cell numbers and cell cycle profile on day 3 after transfection of UTX-siRNA 01 compared to control siRNA. Note that only a population of small cells normally located in the center of the colonies survives and the cell cycle profile shows increased fractions of cells in the G2/M and sub-G1 phases. (c) Caspase-Glo 3/7 activity relative to total viable cells measured by CellTiter-Glo assay 3 days after treatment with control siRNA or UTX-siRNA. (d) FACS analysis of cell size and KRT14 expression. Note the shift towards smaller cells in the FSC-A channel and an increased fraction of KRT14high cells. Number of analyzed experiments n = 3. (e) UTX, p53, p21 and MDM2 protein expression in BFTC-905 cells 2 days after transfection with control siRNA or UTX-siRNA. α-Tubulin (TubA) was used as an internal loading control. As a positive control for p53, p21 and MDM2 expression VM-CUB-1 cells were used. Statistics were performed with a one sample t test against a set value of 1 (** p < 0.01; *** p < 0.001). The UTX siRNA knockdown samples at different time points were compared using an unpaired students t test. Scale 100 µm. The uncropped blots and molecular weight markers of (a) and (e) are shown in Figures S4 and S5.

