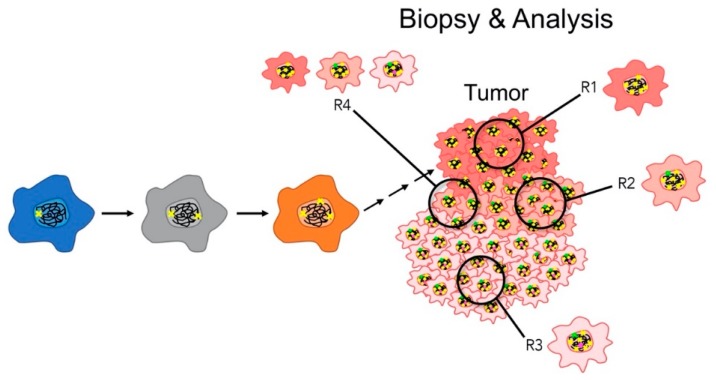
Figure 3.
Impact of CIN on regional biopsies and subsequent analyses. A schematic showing how CIN (represented by arrows) induces genetic diversity (colored ‘x’) within a given tumor (represented by color changes). Note that the ability to glean tumor-specific insight (trunk versus branch alterations) into the aberrant genetics driving tumor development and progression is impacted by regional sampling and the composition and clonality of the tumor cells contained within the biopsied region. Single region bias is demonstrated by the four distinct regions (R1–4), which exhibit variation in both the type of clones identified (R1–3) and in the composition (presence and frequency) of the clones (R4) contained within a given biopsy.

