Figure 1.
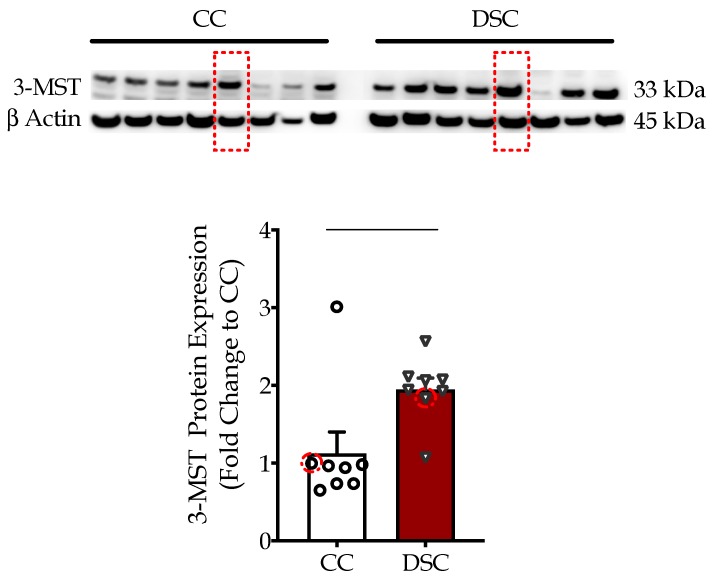
Down syndrome cells (DSC) exhibit significantly higher 3-MST protein expression compared to control cells (CC) as shown by Western blotting. We used β-actin as a loading control. Each bar represents the mean ± SEM of 8 human healthy control fibroblasts and 8 human Down syndrome fibroblasts (summarized in Table 1). ** p < 0.01. Similar to our previous study [9], the normal fibroblast cell line Detroit 551 and the Down syndrome fibroblast Detroit 539 were compared in the subsequent functional studies. 3-MST and β-actin expression in these two selected cell lines are indicated with red dotted squares.

