Figure 3.
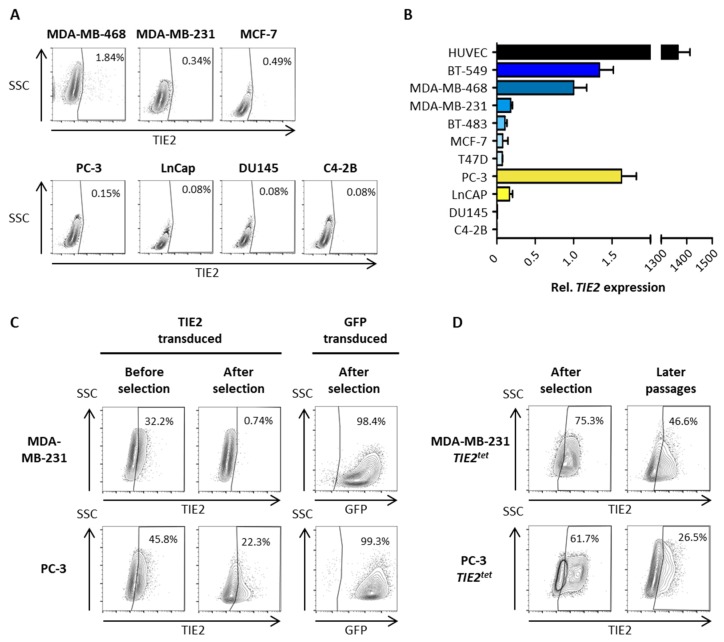
TIE2 expression is low in cancer cell lines in culture. (A) Evaluation of TIE2 protein expression in breast cancer (BCa) and prostate cancer (PCa) cell lines using flow cytometry. (B) Evaluation of TIE2 mRNA expression using RT-qPCR. (C) MDA-MB-231 and PC-3 cells were transduced with lentiviral particles to over-express TIE2 or GFP. Expression was measured by flow cytometry five days after transduction (before selection) and three weeks after transduction (after selection). (D) MDA-MB-231 and PC-3 cells were transduced to express TIE2 using a Tet-On inducible system. Transduced cells were selected with puromycin, and TIE2 expression was measured by flow cytometry (after selection). MDA-MB-231 cells were then cultured for three weeks, and PC-3 cells were cultured for one week, and TIE2 expression was measured again (later passages). Flow cytometry results are represented as contour plots overlaid with outliers. Values indicate the percentage of TIE2+ cells. TIE2 mRNA expression is represented as the average ± SEM vs. MDA-MB-468 cells.

