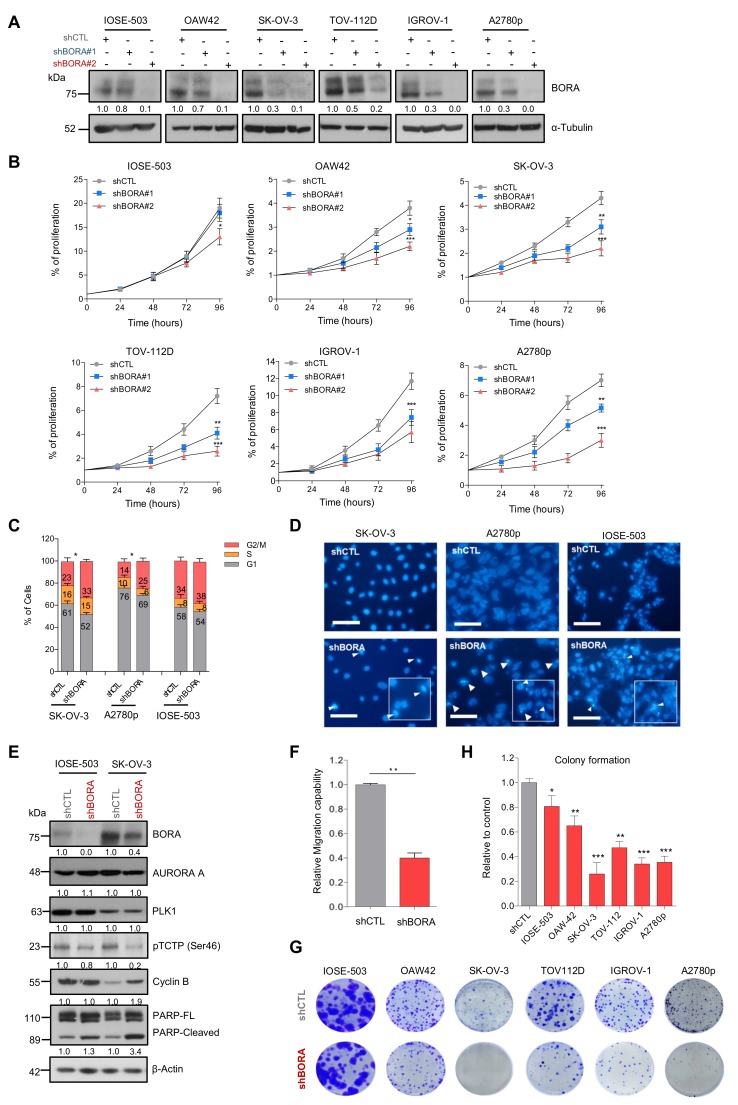
Figure 3.
BORA silencing attenuates proliferation, increases the number of cells in G2/M phase and induces apoptosis cell death in vitro. (A) BORA levels detected by immunoblot in the indicated cell lines infected with nonsilencing control (shCTL) or two different shRNA against BORA (shBORA#1 and shBORA#2). α-Tubulin was used as loading control. (B) Normalized proliferation curves of the indicated OC cell lines infected with shCTL, shBORA#1 and shBORA#2 (herein shBORA), measured by crystal violet staining. (C) Cell cycle profile of SK-OV-3, A2780p and IOSE-503 cell lines infected with shCTL and shBORA viruses. (D) Hoechst staining images of shCTL or shBORA-infected cells in the three lines. Arrowheads point at nuclei with condensed or fragmented chromatin. Bar: 100 μm. (E) Representative immunoblot of BORA, PLK1, AURORA A, pTCTP-Ser46 cyclin B1 and PARP proteins upon BORA silencing in the SK-OV-3 and IOSE-503 cell line. β-Actin was used as loading control. (F) Migration capacities of shCTL and shBORA-SK-OV-3 infected cells. (G) Representative macroscopic images of colony formation assay in shCTL and shBORA- transduced ovarian cell lines after 10–12 days of culture and (H) average quantification of three independent experiments. Graphs represent an average of three independent experiments ± SEM. For B, C, F and H, P-value was calculated using a two-tailed Student’s t- test. * p < 0.05; ** p< 0.01; *** p < 0.001.

