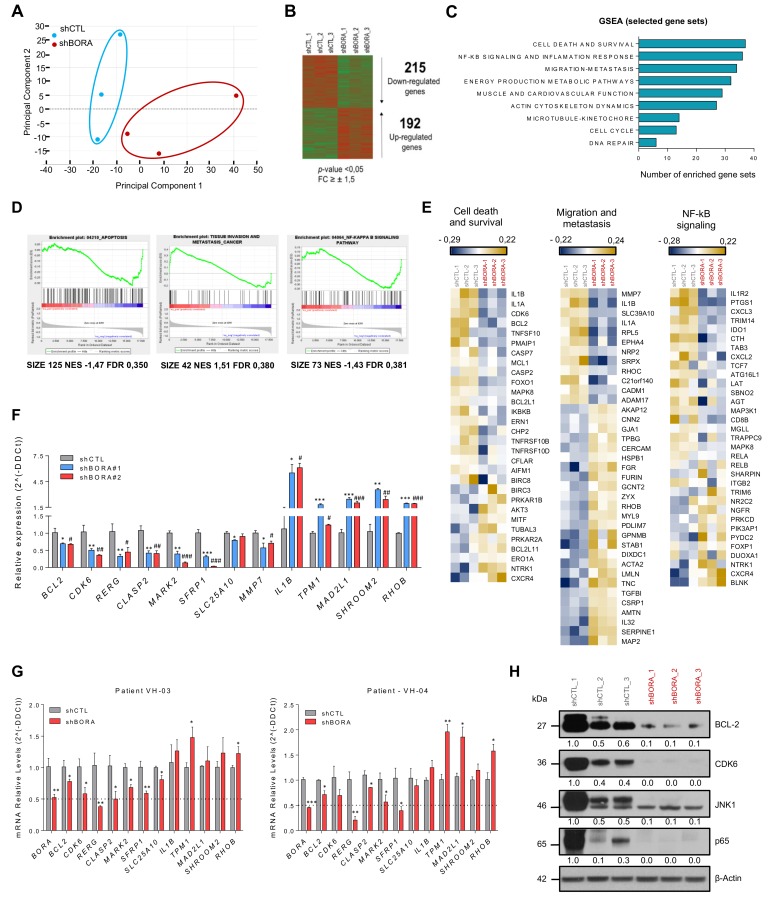
Figure 5.
BORA modulates the expression of survival, migration and NF-κB signaling genes. (A) Principal component analysis illustrates segregation of distinct expression profiles of shCTL and shBORA groups (n = 3/group). Note that Principal Component 1, capturing around 38% of gene expression variance, effectively distinguishes BORA depleted and nondepleted samples. (B) Heat map comparing the transcriptional profiles of shCTL and shBORA samples. (C) Gene set enrichment analysis using the GSEA software using the transcriptome data grouped in different term categories. Major collections from hallmarks, KEGG pathways and GO gene sets were downloaded from MSigDB.v6 and used for the GSEA. Graph represents total number of enriched gene-sets with FDR < 0.5 or p-value < 0.05 plotted regarding each category. (D) Representative GSEA curves for significant enriched gene sets related to cell death, migration and NF-κB signaling pathways. Corresponding size of the gene set, normalized enriched score (NES) and FDR for enriched gene sets are included. (E) Heat maps indicating selected differentially deregulated genes grouped in categories of the relevant pathways. The color key shows relative expression levels of the differentially expressed genes (yellow corresponds to overexpressed genes while blue corresponds to underexpressed genes). (F) Array validation by quantitative real-time PCR using two independent shRNA particles in the SK-OV-3 cell line. Values of shBORA#1 and shBORA#2 are represented as fold change versus shCTL. (G) Quantitative real-time PCR of the indicated genes in two patient-derived ascites cells transduced with either shCTL or shBORA viruses. GAPDH was used as endogenous control. Relative fold-change in expression was determined by the comparative 2(-ΔΔCt) method. (H) Immunoblot of the indicated proteins to verify the alteration in abovementioned pathways. Protein lysates used derived from the BORA and control depleted tumors from the in vivo experiment. β-Actin was used as a loading control. p-value was calculated in F and G using a two-tailed Student’s t- test. * Compares shCTL versus shBORA#1 and # compares shCTL versus shBORA#2; *, # p< 0.05; **, ## p< 0.01; ***, ### p < 0.001.

