
Figure 1.
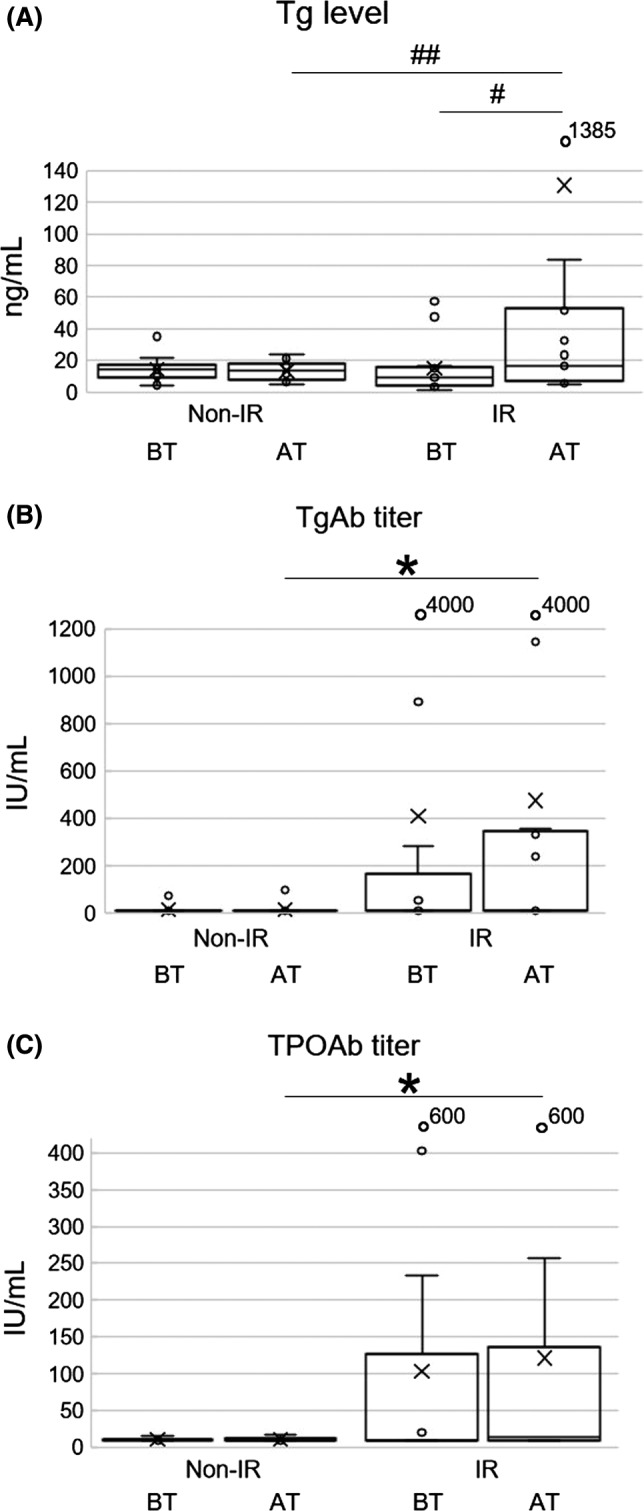
Box‐and‐whisker plots are shown. Minimum, lower quartile, median, upper quartile, and maximum levels are shown as indicated. Average levels are shown as ‘x’. Levels or titers of each factors at baseline (BT) and 4 wk after first ICI treatment (AT) are shown (A‐C). A, Serum Tg levels in the IR group were significantly increased from BT to AT (# P < .05). In addition, the ratio of AT/BT in the IR group was also greater than that of the non‐IR group (## P < .05). B, TgAb titers at AT in the IR group were significantly higher than those in the non‐IR group (*P < .05). C, TPOAb titers at AT in the IR group were significantly higher than those in the non‐IR group (*P < .05)