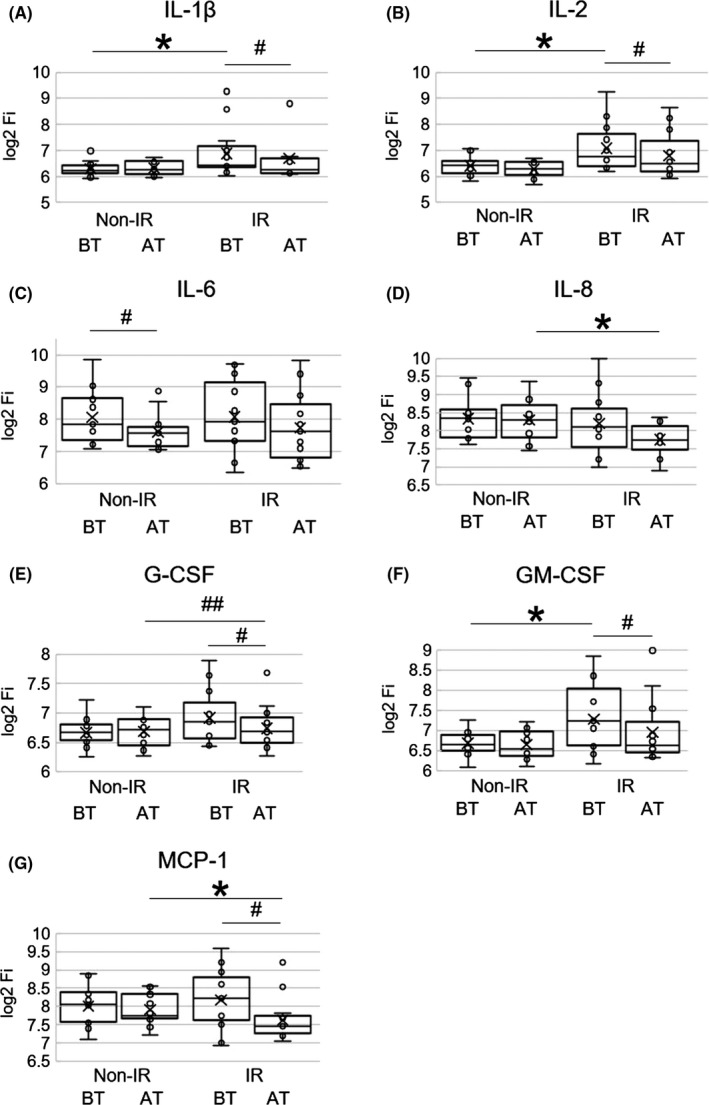
Figure 2.

Box‐and‐whisker plots are shown. Fluorescence intensity (Fi) values of each cytokine or chemokine were measured. Log2 transformed Fi values are shown on the y axis.11 Results at baseline (BT) and 4 wk after first ICIs treatment (AT) in each group are represented. Minimum, lower quartile, median, upper quartile, and maximum levels are shown as indicated. Average levels are shown as ‘x’. A, Serum IL‐1β values at BT in the IR group were significantly higher than those in the non‐IR group (*P < .05). Serum IL‐1β values in the IR group were significantly decreased from BT to AT (# P < .05). B, Serum IL‐2 values at BT in the IR group were significantly higher than those in the non‐IR group (*P < .05). Serum IL‐2 values in the IR group were significantly decreased from BT to AT (# P < .05). C, Serum IL‐6 values in the non‐IR group were significantly decreased from BT to AT (# P < .05). D, Serum IL‐8 values at AT in the IR group were significantly lower than those in the non‐IR group (*P < .05). E, Serum G‐CSF values in the IR group were significantly decreased from BT to AT (# P < .05). The ratio of AT/BT was significantly different between the two groups (## P < .05). F, Serum GM‐CSF values at BT in the IR group were significantly higher than those in the non‐IR group (*P < .05). Serum GM‐CSF values in the IR group were significantly decreased from BT to AT (# P < .05). G, Serum MCP‐1 values at AT in the IR group were significantly lower than those in the non‐IR group (*P < .05). Serum MCP‐1 values in the IR group were significantly decreased from BT to AT (# P < .05)
