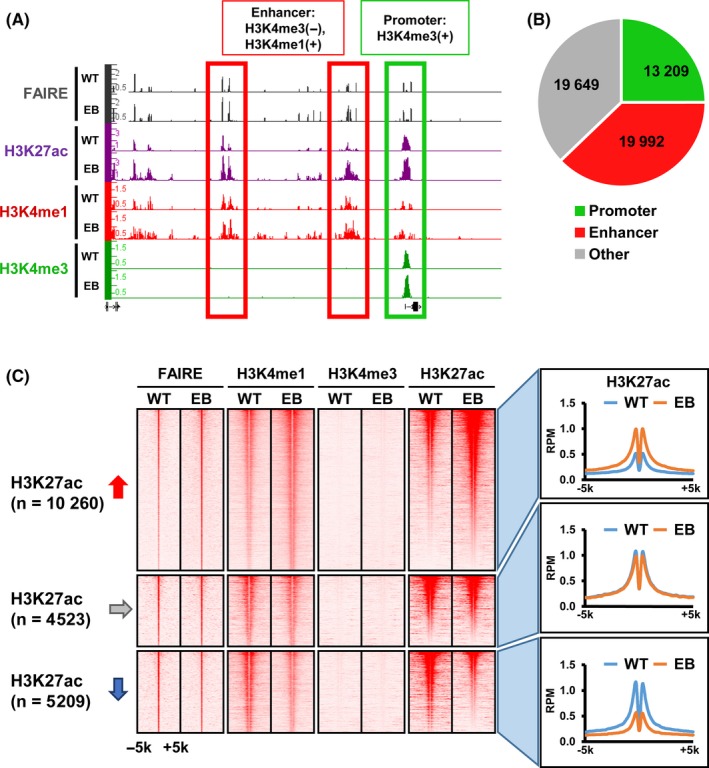
Figure 1.

Detection of activated enhancers in Epstein‐Barr virus (EBV)‐infected MKN7 cells, MKN7_EB WT, MKN7_WT EB, and MKN7_EB. A, Representative formaldehyde‐assisted isolation of regulatory elements (FAIRE) signals on promoter and enhancer regions. Promoter and enhancer regions were defined as H3K4me3 peaks, and as H3K4me1 peaks without H3K4me3 signal, respectively. B, Distribution of FAIRE peaks. Among 52 850 FAIRE peaks in MKN7_EB, 13 209 and 19 992 peaks were detected in promoter regions and enhancer regions, respectively. C, Alteration of H3K27ac signals around 19 992 FAIRE peaks on enhancer regions. Heatmaps represent read densities of FAIRE, H3K4me1, H3K4me3 and H3K27ac within the ±5‐kb region from the FAIRE peak center (left). Histograms indicate the average read per million (RPM) reads of H3K27ac within ±5‐kb regions from the FAIRE peak center (right). The 10 260 and 5209 regions showed increase and decrease of the H3K27ac signals, respectively
