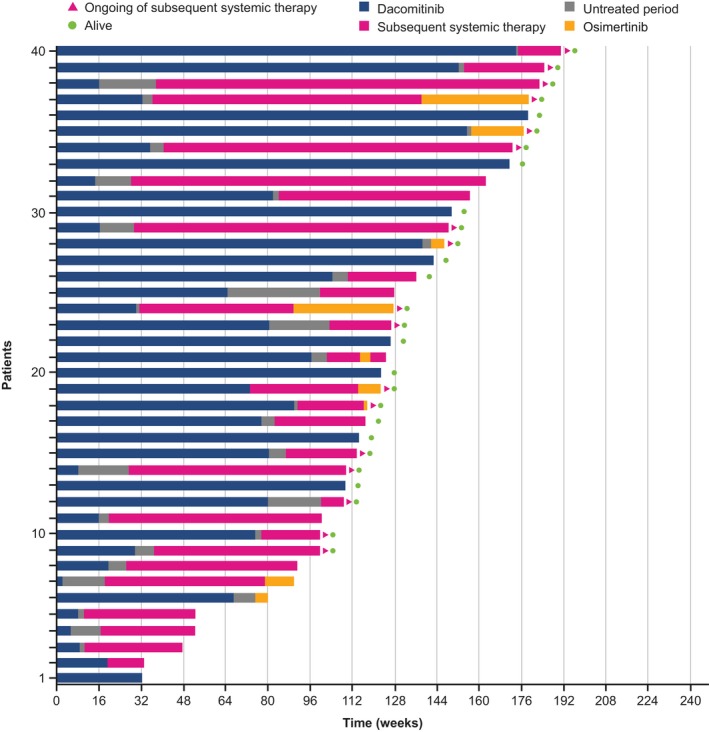
Figure 4.

Total duration of treatment by dacomitinib and subsequent systemic anti‐cancer therapy (Japanese safety population; cutoff date: February 17, 2017). The duration of treatment with dacomitinib is shown in blue, with subsequent systemic anti‐cancer therapy (including the interval between subsequent systemic anti‐cancer therapies) in red, with osimertinib in yellow. The period between dacomitinib treatment and subsequent systemic anti‐cancer therapy is shown in gray. Green dots indicate patients who remained alive at the time of data cutoff. Red arrowheads indicate patients who are ongoing the subsequent systemic therapy at the time of data cutoff
