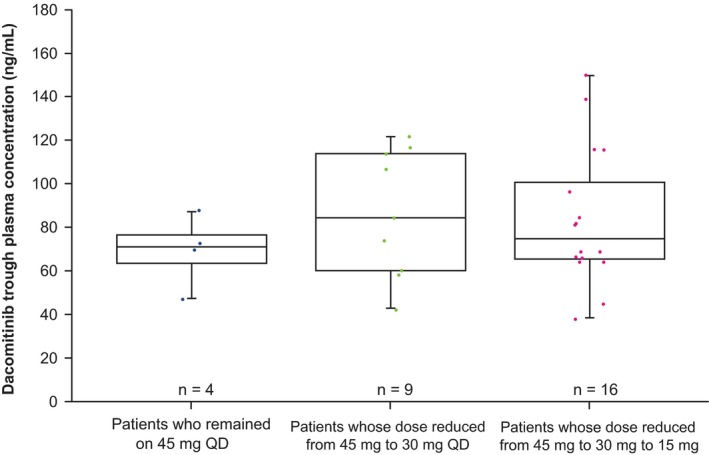
Figure 7.

Comparison of dacomitinib initial exposure after the first cycle of treatment by lowest dose on study arm (Japanese safety population; cutoff date: July 26, 2016). Horizontal bars within each box represent the median. The top and bottom borders of each box represent the 75th and 25th percentiles. The error bars above and below each box represent the 90th and 10th percentiles. QD, once daily
