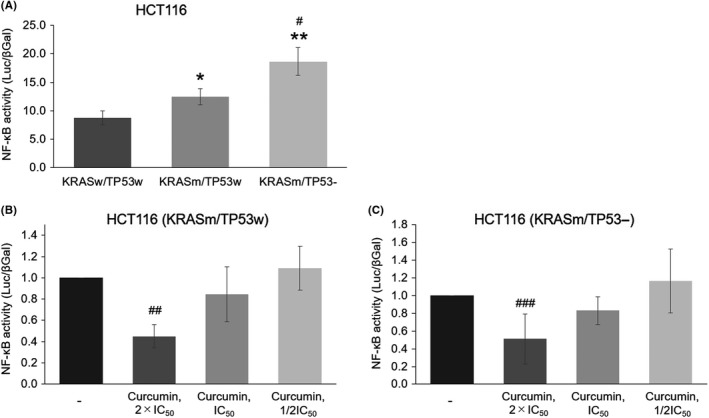
Figure 3.

Inhibition of NF‐κB activity by curcumin in vitro. A, Baseline NF‐κB activity on each HCT116 cell line. *P < 0.05 and **P < 0.01, as compared to KRASw/TP53w cells; #P < 0.01, as compared to KRASm/TP53w. B, Dose‐dependent inhibition of NF‐κB activity by curcumin in KRASm/TP53w cells. The IC50 value of curcumin is 20.0 μM. ##P < 0.01, as compared to no treatment. C, Dose‐dependent inhibition of NF‐κB activity by curcumin in KRASm/TP53‐ cells. IC50 value of curcumin is 17.4 μM. ###P < 0.05, as compared to no treatment
