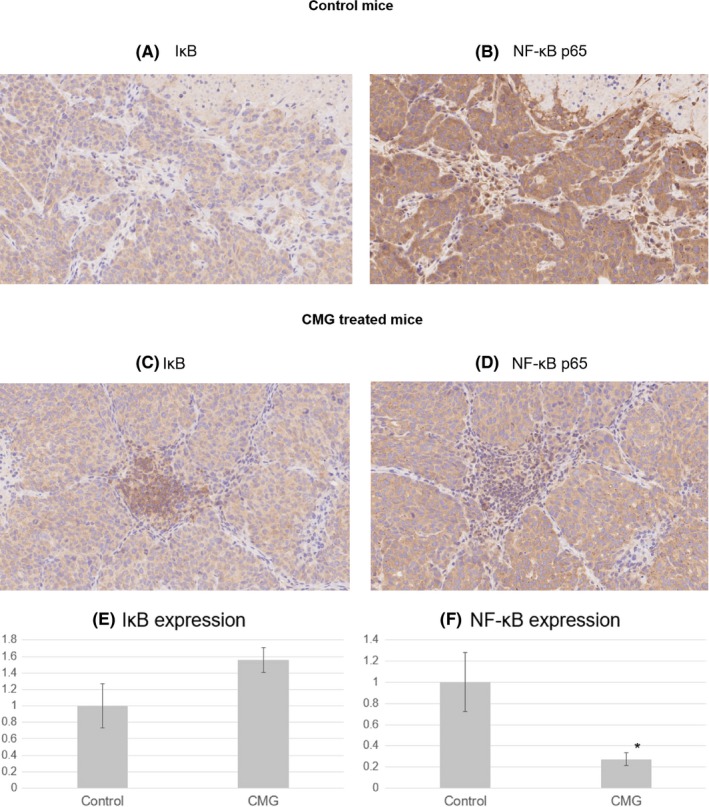
Figure 7.

Immunohistochemical analysis of IκB and NF‐κB. Serial sections of the tumors were immunostained for IκB or NF‐κB (p65) antibodies. Representative images are shown (×400). A, IκB staining in control mice. B, NF‐κB staining in control mice. C, IκB staining in CMG‐treated mice. D, NF‐κB staining in CMG‐treated mice. E, A quantitative analysis of IκB staining signals. F, A quantitative analysis of NF‐κB staining signals. Data represent means ± SD (n = 3). *P < 0.05
