
Figure 5.
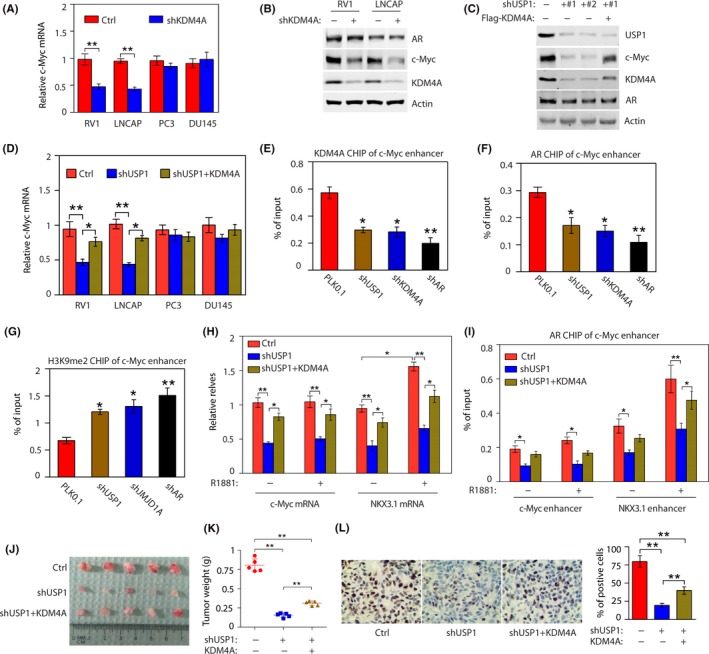
c‐Myc is a downstream effector of the USP1‐KDM4A axis in androgen receptor (AR)‐positive cells. A, c‐Myc mRNA levels were detected in AR‐positive cells (RV1 and LNCAP) and AR‐negative cells (PC3 and DU145) stably expressing control (Ctrl) or KDM4A shRNAs (#1 and #2). **P < .01. B, Western blotting of AR‐positive cells (RV1 and LNCAP) to examine the indicated proteins. C, RV1 cells stably expressing control (Ctrl) or USP1 shRNAs with or without Flag‐KDM4A were analyzed by western blot. D, c‐Myc mRNA levels were detected in indicated cells stably expressing Ctrl or USP1 shRNAs with or without Flag‐KDM4A. *P < .05; **P < .01. E, RV1 cells were transduced with USP1, KDM4A, or AR shRNAs for 48 h and subjected to ChIP assay using anti‐KDM4A Ab. Chromatin was analyzed by quantitative PCR (qPCR) for regions of the c‐Myc enhancer showing an androgen‐responsive element (ARE). Knockdown (KD) of USP1, KDM4A, or AR decreased KDM4A binding to ARE region. *P < .05; **P < .01. F, Cells as described in (E) were subjected to ChIP assay using anti‐AR Ab. Chromatin was analyzed by qPCR for regions of the c‐Myc enhancer showing an ARE. KD of USP1, KDM4A, or AR decreased AR binding to ARE region. *P < .05; **P < .01. G, Cells as described in (F) were subjected to ChIP assay using anti‐H3K9Me2 Ab. KD of USP1, KDM4A, or AR decreased H3K9Me2 binding to ARE region. *P < .05; **P < .01. H, RV1 cells stably expressing Ctrl or USP1 shRNAs with or without Flag‐KDM4A were maintained in growth media containing 5% charcoal‐stripped FBS with or without 1 nmol/L R1881 for 48 h, then c‐Myc and NKX3.1 mRNA levels were detected. *P < .05; **P < .01. I, Cells as described in (H) were subjected to ChIP assay by anti‐AR Ab. Chromatin was analyzed by qPCR for regions of the c‐Myc enhancer and NKX3.1 enhancer showing AREs. J, K, RV1 cells stably expressing Ctrl or shUSP1 RNAs were injected into BALB/c nude mice. Tumor images and weights are shown (mean ± SD of 5 mice). All statistical analyses were undertaken with ANOVA. *P < .05; **P < .01. L, Representative staining of Ki‐67 on tumor sections derived from above. Staining by DAB (brown) and counterstained by hematoxylin (blue). Percentages of Ki‐67‐positive cells are shown. **P < .01 (ANOVA)