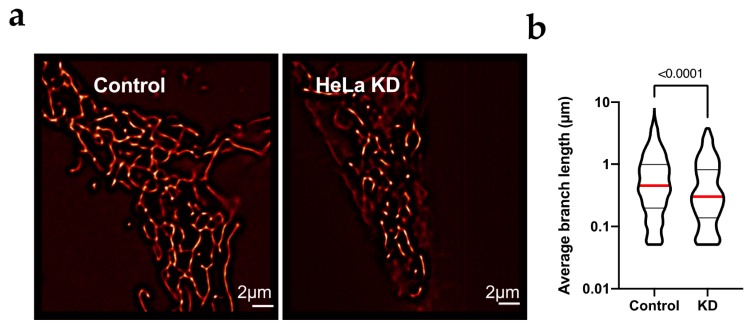
Figure 3.
HeLa KD cells show mitochondrial fragmentation. (a) For detailed structure analysis, stacks of 100 images were analyzed by SRFF in HeLa and HeLa KD cells; representative examples are shown. (b) Average branch length in HeLa cells was larger then in HeLa KD cells. The median value is indicated by a red line and the number indicates the value of p obtained by non-parametric Mann-Whitney test since the limit in resolution renders the distributions not normal.

