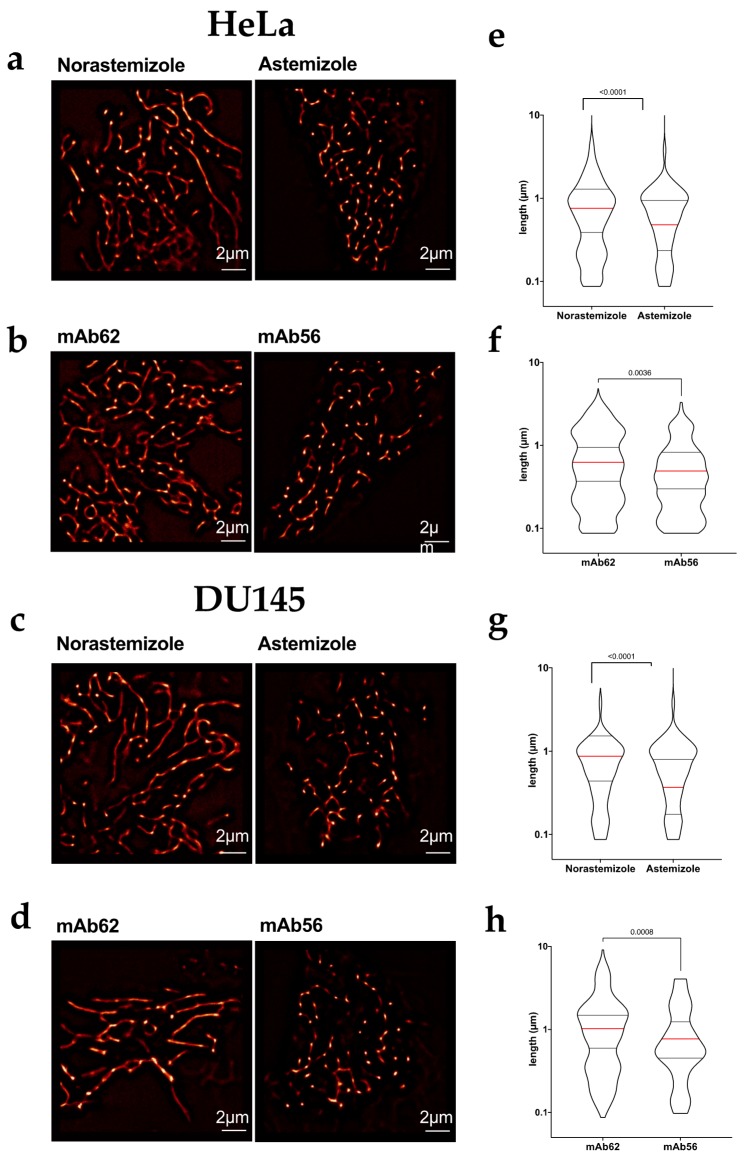
Figure 4.
Pharmacological blockage of Kv10.1 induces mitochondrial fragmentation (a–d) Representative SRRF images of HeLa (a,b) and Du145 (c,d) cells treated with the indicated agents for 24 h, stained with Mitotracker Red and imaged in vivo using stacks of 200 images by spinning disc microscopy. Both blockers, Astemizole (5 µM) and mAb56 (10 µg/mL) induced mitochondrial fragmentation as compared with the respective controls Norastemizole and mAb62 at the same concentration. (e–h) The length of individual mitochondria under each condition was estimated by identifying skeletons in Fuji software. In e–h, the median value is indicated by a red line and the number indicates the value of p obtained by non-parametric Mann-Whitney test since the limit in resolution renders the distributions not normal.

