Figure 5.
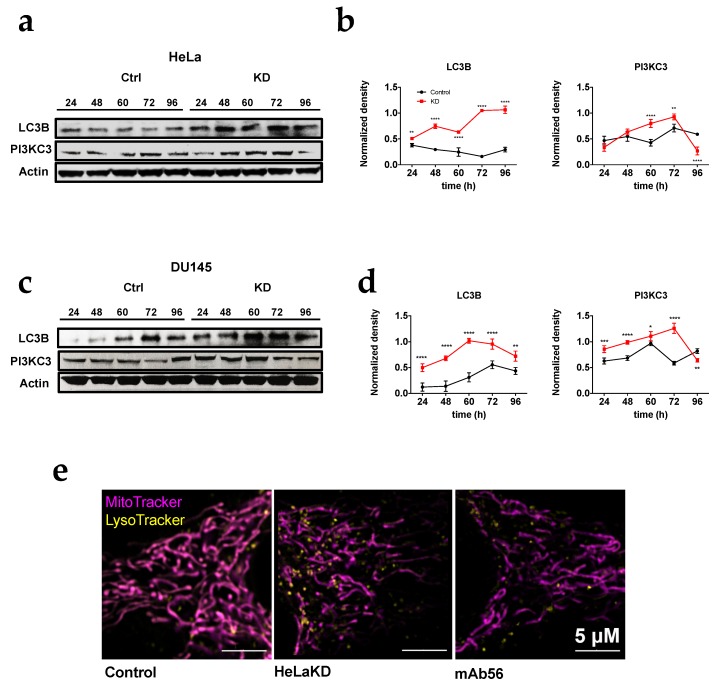
HeLa KD and DU145KD cells show an increase in autophagic components. (a) Representative blots of proteins involved in autophagy in HeLa and HeLa KD cells. Actin was used as a loading control in all cases. (b) Densitometric analysis of the autophagic protein content HeLa and HeLa KD cells the values were normalized to actin. (c) Representative Western blots in DU145 and DU145KD cells. (d) Densitometric analysis of the autophagic protein content DU145 and DU145KD cells the values were normalized to actin. (e) Cells treated with control siRNA (left), Kv10.1 siRNA (center) or mAb56 (right) were incubated with Mitotacker (mitochondria, magenta) and Lysotracker (lysosomes, yellow) and analyzed in live cells by confocal microscopy (Airy super resolution). Note the increase in LysoTracker signal in KD and mAb56 treated cells. values in (b,d) are mean ± SEM of three independent experiments (* p < 0.05. ** p < 0.01. **** p < 0.001, **** p < 0.0001, 2-way ANOVA).

