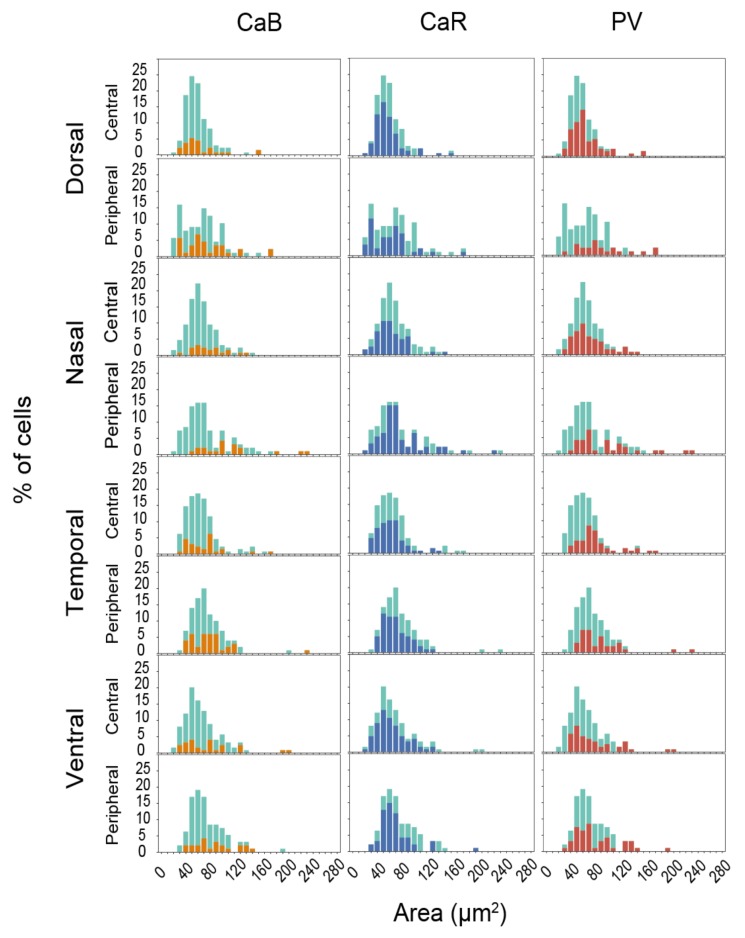
Figure 3.
Soma size distribution histograms of CaBP expressing RGCs. The cell size distribution of all RGCs (light blue) and CaBP expressing RGCs (CaB: orange, CaR: blue, PV: red). The bin widths are set at 10 µm2. Note, that only data from quadruple labeling experiments (CaR, CaB, PV, NeuN) were used for this analysis, thus light blue histograms (all cells) are the same across all rows present.

