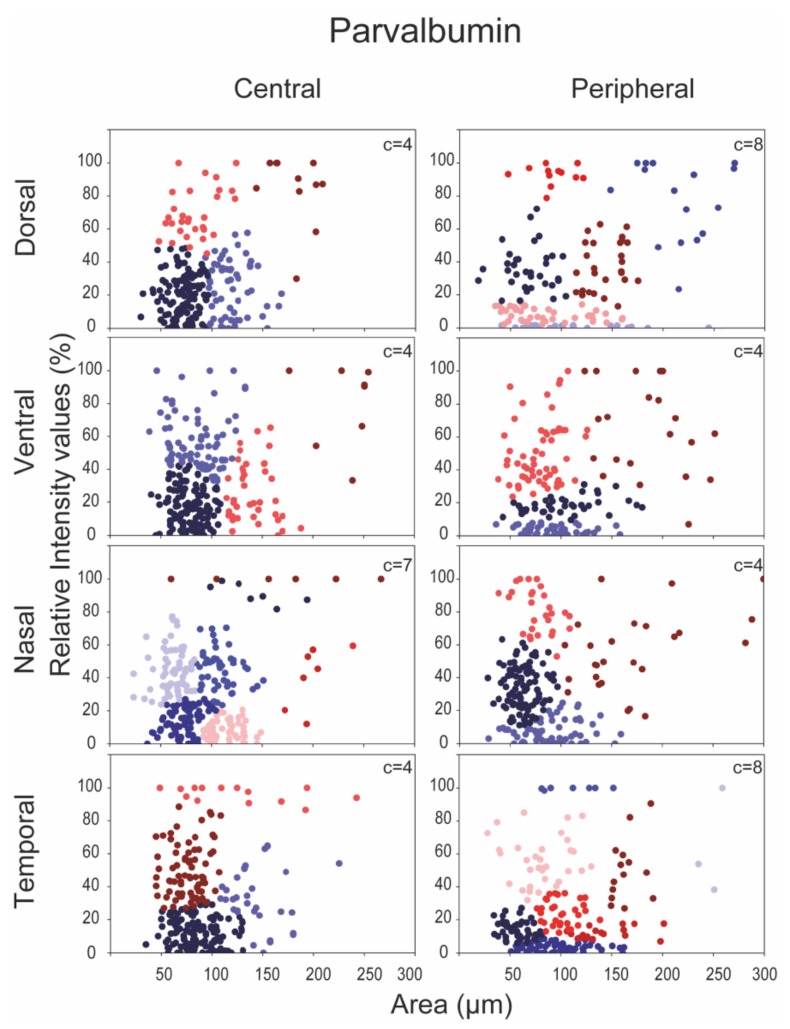
Figure 6.
Cluster analysis of PV expressing RGCs. Two features, RGC soma size and PV expression level, were utilized to perform the clustering in both central (left) and peripheral (right) retinal areas separately for each quadrant. Dots indicate individual cells from n = 6 retinas. The clusters of RGCs are color-coded (note that colors do not necessarily represent the same cluster in separate panels). The number of clusters is shown in the top right corner of each graph.

