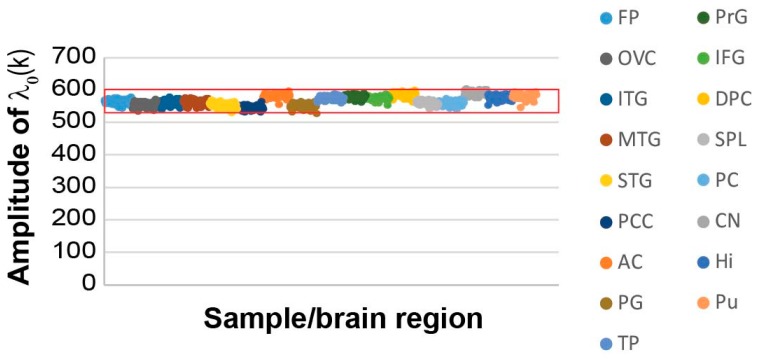
Figure 2.
The studied 951 non-demented and AD-bearing brain samples harbor a similar steady state process. The amplitudes, λ0(k), of the steady state for all samples are presented, demonstrating an invariant amplitude across the 951 samples. The data is color-coded to show the different brain regions (frontal pole (FP), occipital visual cortex (OVC), inferior temporal gyrus (ITG), middle temporal gyrus (MTG), superior temporal gyrus (STG), posterior cingulate cortex (PCC), anterior cingulate (AC), parahippocampal gyrus (PG), temporal pole (TP), precentral gyrus (PrG), inferior frontal gyrus (IFG), dorsolateral prefrontal cortex (DPC), superior parietal lobule (SPL), prefrontal cortex (PC), caudate nucleus (CN), hippocampus (Hi) and putamen (Pu)). The red box marks the error limits, which were calculated for the steady state based on the expression values of the transcripts that were found to participate in the steady state (Table S1) [26].

