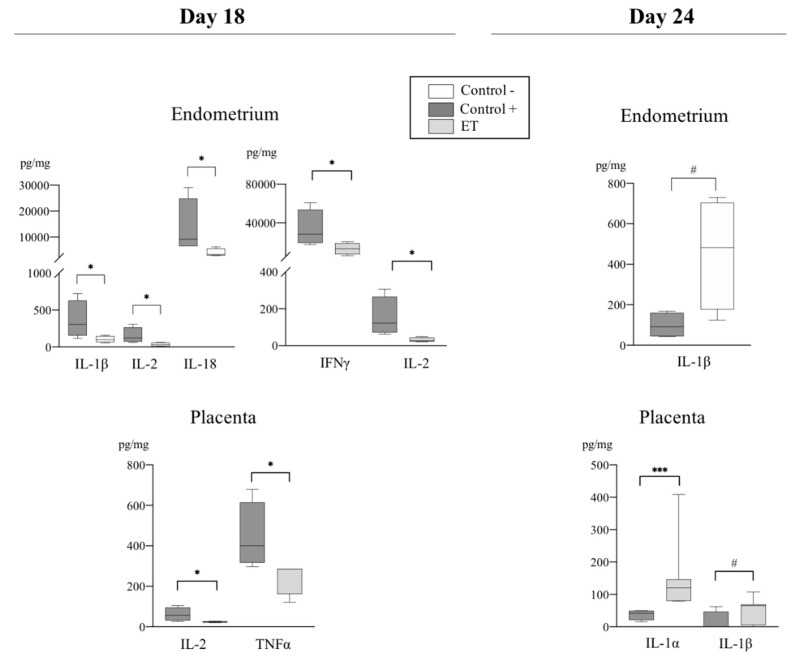
Figure 3.
Relative abundance of pro-inflammatory cytokines (pg/mg of total protein) among experimental groups (C+, C−, and ET) at Day 18 and Day 24 of pregnancy in samples from endometrium and placenta. Data are presented by box plot showing median and inter-quartile range (Q1-Q3). Asterisks indicate significant differences among groups (* p < 0.05; *** p < 0.001; # Tendency p < 0.07).

