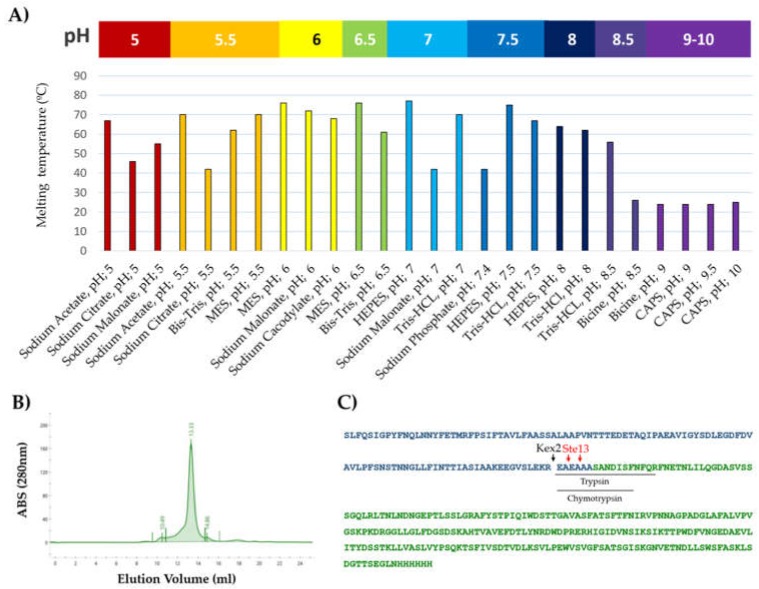
Figure 2.
Characterization of rTBL-1: (A) Melting temperatures of rTBL-1 obtained through thermal shift assay (TSA). A temperature gradient from 20 to 100 °C was applied under 26 different buffer conditions in a pH range from 5 to 10. (B) Size exclusion chromatogram of rTBL-1: The column was calibrated using the gel filtration standard #15119001 (Bio-Rad). (C) Sequence of rTBL-1 by mass spectrometry; green depicts rTBL-1 sequence; blue represents α-factor sequence; black lines indicate the most abundant tryptic and chemotryptic N-terminal peptides found in the digested samples; and cleavage sites for Kex2 and Ste13 are indicated by black and red arrows, respectively.

