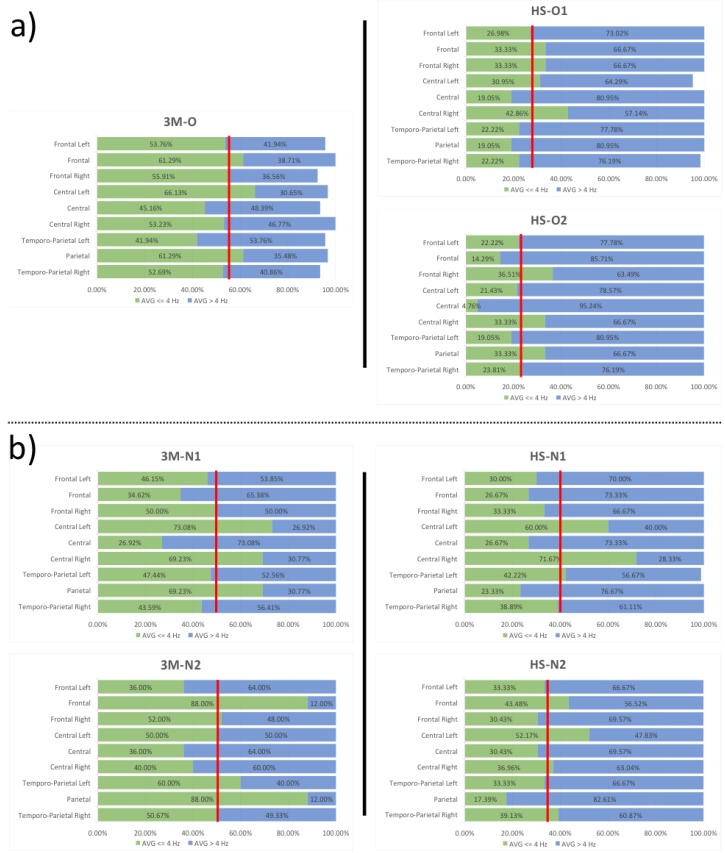
Figure 3.
Representation of the percentage of trials (horizontal axis) divided by ROIs (vertical axis), for which 60% of the power spectrum area was ≤ 4 Hz (green) or > 4 Hz (blue) for each of the treated infants. A sum less than 100% indicates that some trials were too corrupted to be treated and, hence, discarded; this phenomenon mainly occurred for subject 3M-O. Data regarding subject 3M-O and the corresponding controls HS-O1/HS-O2 are reported in a) and 3M-N1/3M-N2 and the corresponding shared controls are reported in b). Vertical bars indicate the average threshold; differences are apparent between patients and controls.

