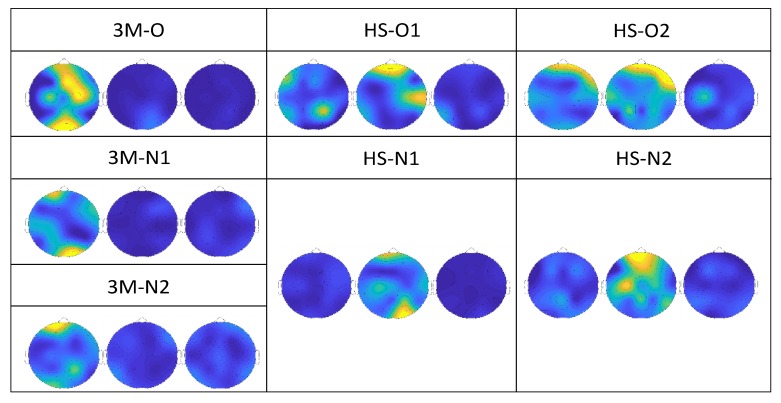
Figure 4.
Topoplot images that report the power spectrum distribution of one of the typical trials for each infant. Each of the three topoplots refers to an analysed bandwidth: 0.01–4 Hz (left), 4–8 Hz (middle) and 8–12 Hz (right). The scale was normalized between 0 and 1 (0 = intense blue, 1 = intense yellow) for all subjects and is not shown for convenience. The data disposition resembles that of Figure 1. For patients with 3M syndrome (left column), the left topoplot (0.01–4 Hz) carried most of the power; for healthy subjects (middle and right columns), most of the power was concentrated in the middle topoplot (4–8 Hz). For all subjects, the right topoplot (8–12 Hz) contained negligible power with respect to the lower frequency windows.

