Figure 1.
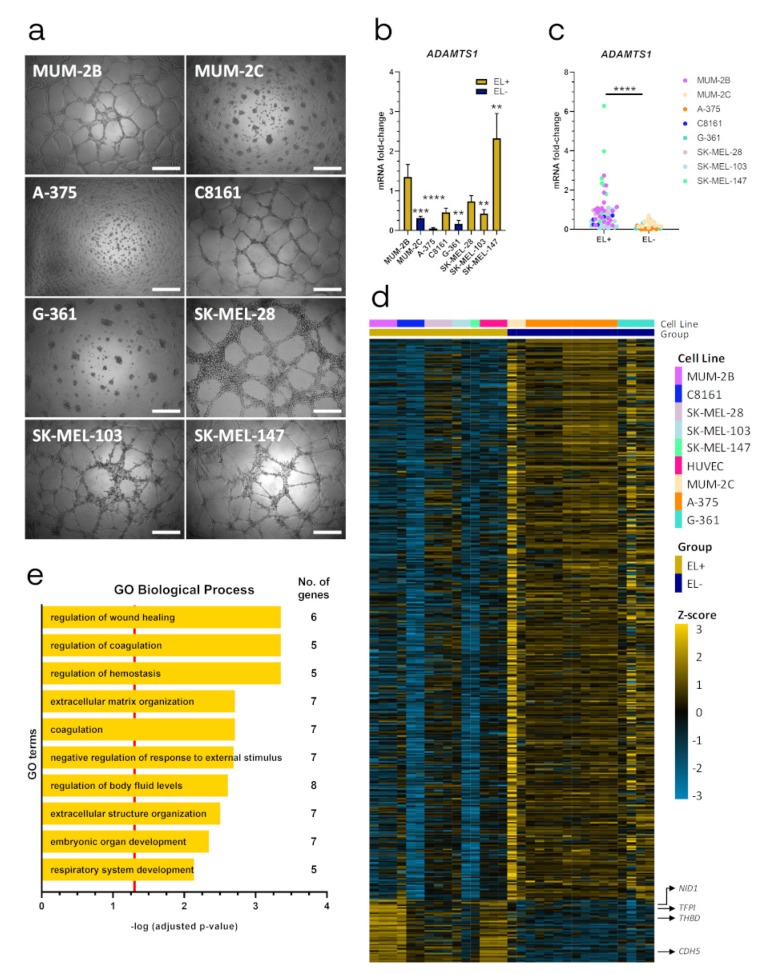
Endothelial-like properties of melanoma cells and correlation with ADAMTS1 expression. (a) Representative images of 3D Matrigel-based assay of human melanoma cell lines, 24 h after seeding. 20,000 cells/well were cultured for MUM-2B, SK-MEL-147, C8161, MUM-2C and SK-MEL-103; and 30,000 cells/well for SK-MEL-28, G-361 and A-375 (white scale bar = 500 µm); (b) Graph representing mRNA fold change expression of ADAMTS1 in human melanoma cell lines. Values are relative to MUM-2B (n = 21 for MUM-2B, n = 17 for MUM-2C, n = 11 for A-375, n = 5 for C8161 and SK-MEL-28, n = 6 for G-361, n = 15 for SK-MEL-103 and n = 9 for SK-MEL-147). EL+ and EL− phenotypes are indicated; (c) Graph representing mRNA fold change expression of ADAMTS1 in human melanoma cell lines, according to their EL+ or EL− phenotype (values are based in same data that Figure 1C); (d) Heatmap showing differential gene expression between EL+ (including HUVECs) and EL− cell lines. Only significant differently expressed genes are depicted (47 upregulated and 420 downregulated, FDR < 0.05). Gene Expression Omnibus (GEO) ID samples are listed and color coded in Table S2; (e) Representation of top ten GO Biological Processes after enrichment analysis using significantly upregulated genes in EL+ cells. Red line determined the limit of significance: -log (0.05). (****, p < 0.0001; ***, p < 0.001; and **, p < 0.01).

