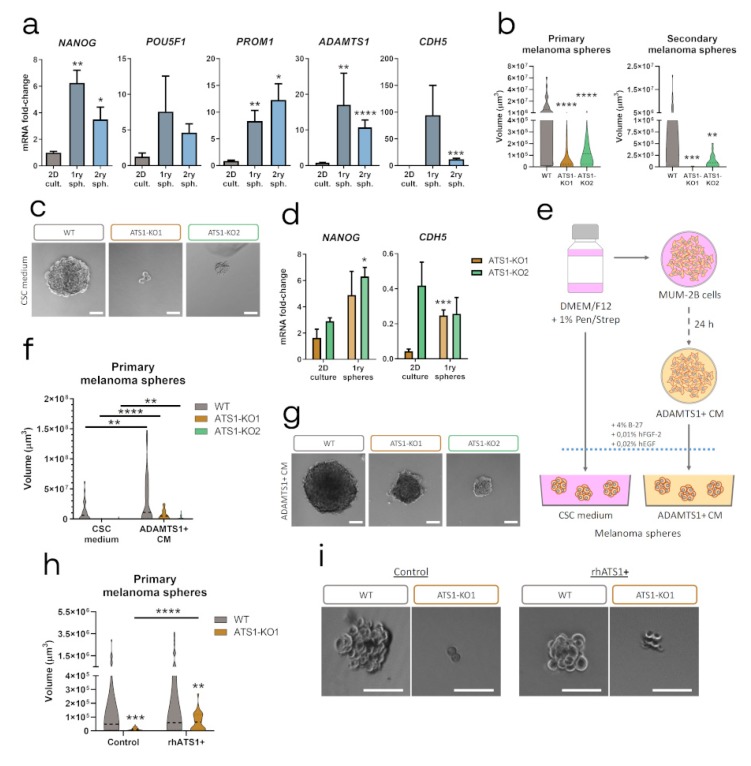
Figure 5.
Inhibition of ADAMTS1 compromises melanoma sphere formation. (a) Graphs representing mRNA fold-change expression of NANOG, POU5F1, PROM1, ADAMTS1 and CDH5 in MUM-2B WT 2D culture, primary and secondary melanoma spheres (n = 4 for 2D culture, except for ADAMTS1 which is 12; n = 2–5 for primary spheres, and n = 4–6 for secondary spheres). 2D cultured cells were used as control for statistical analyses; (b) Violin plots representing volume of primary (n = 49 for WT, n = 62 for ATS1-KO1, and n = 58 for ATS1-KO2) and secondary (n = 46 for WT, n = 34 for ATS1-KO1 and n = 21 for ATS1-KO2) melanoma spheres. WT spheres volume was used as control for statistical analyses; (c) Representative images of WT and ATS1-KO primary melanoma spheres grown in CSC medium; (d) Graphs representing mRNA fold-change expression of NANOG and CDH5 in 2D culture (n = 4–6 for ATS1-KO1 and n = 2–4 for ATS1-KO2) and primary melanoma spheres (n = 2 for ATS1-KO1 and n = 4–7 for ATS1-KO2). 2D cultured conditions were used as control for statistical analyses; (e) Schematic protocol for melanoma spheres formation, using CSC medium and ADAMTS1+ CM; (f) Violin plots representing volume of WT and ATS1-KO primary melanoma spheres grown in CSC medium (n = 49 for WT, n = 62 for ATS1-KO1, and n = 58 for ATS1-KO2) or in ADAMTS1+ CM (n = 44 for WT, n = 48 for ATS1-KO1, and n = 49 for ATS1-KO2); (g) Representative images of WT and ATS1-KO primary melanoma spheres in ADAMTS1+ CM; (h) Violin plots representing WT and ATS1-KO1 primary melanoma spheres, grown in control CSC (n = 27 for WT, and n = 44 for ATS1-KO1) or rhATS1+ CSC medium (n = 35 for WT, and n = 28 for ATS1-KO1); (i) Representative images of WT and ATS1-KO1 primary melanoma spheres grown in control and rhATS1+ CSC medium. (****, p < 0.0001; ***, p < 0.001; **, p < 0.01; *, p < 0.05. Violin plots indicate the median of every experimental group. White scale bar = 100 µm).

