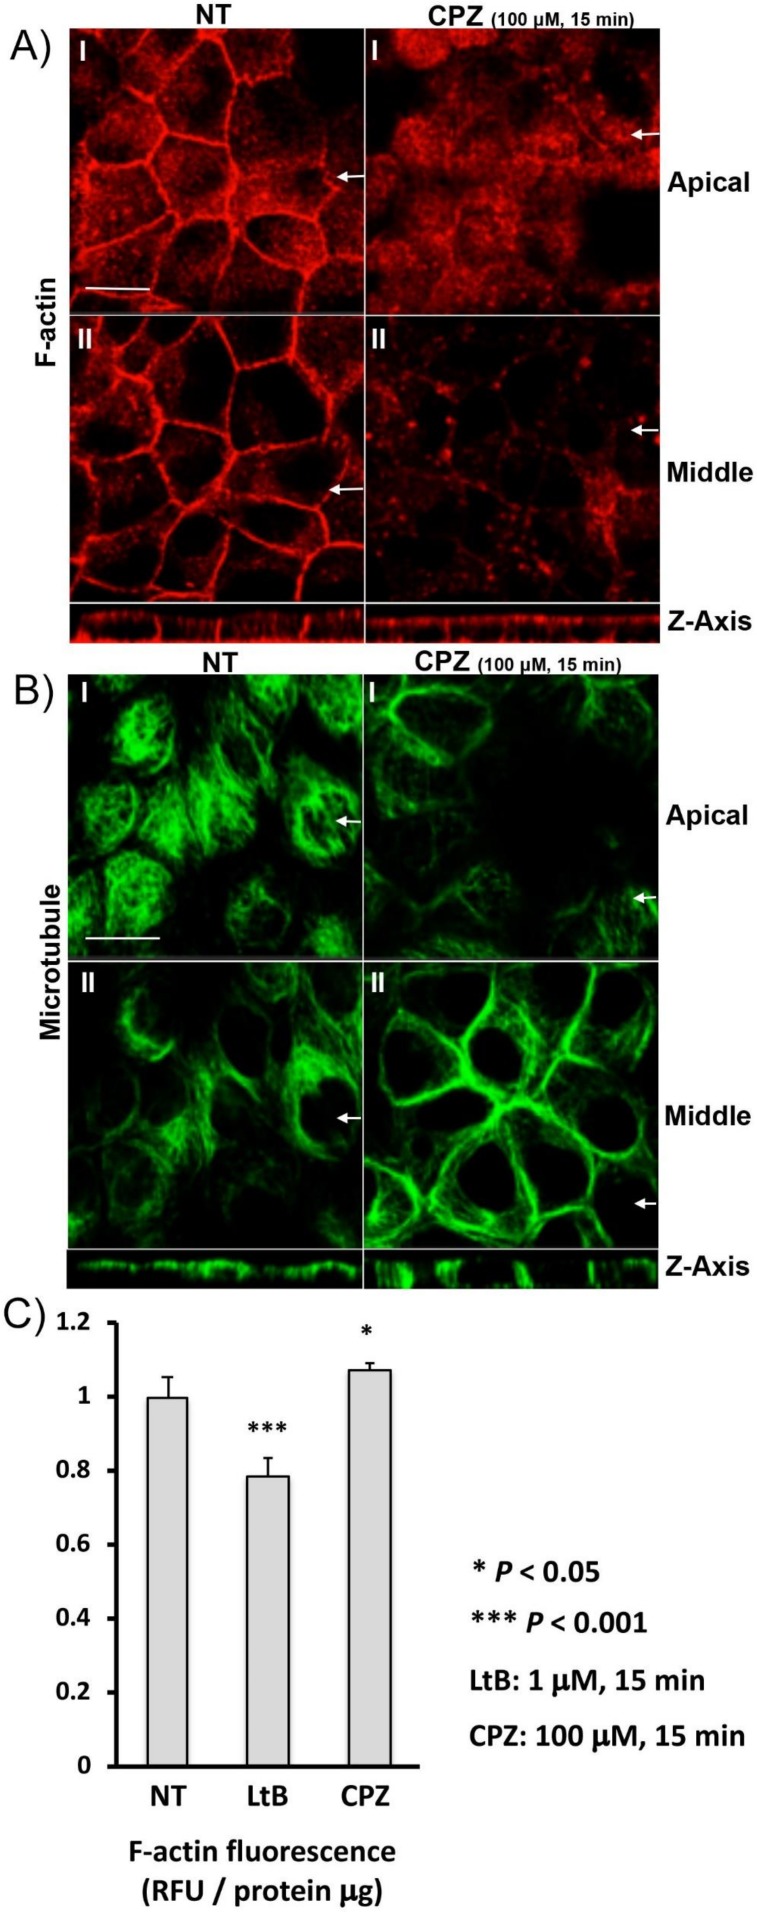
Figure 5.
CPZ selectively disrupts basolateral actin but increases basolateral tubulin in polarized MDCK cells: (A) AQP2-MDCK cells were treated 15 min with 100 µM CPZ (right panels) or without CPZ (NT, left panels). F-actin was visualized using rhodamine phalloidin. The larger panels represent confocal sections of the apical (‘) and the middle region (“) of the cell monolayer. The smaller horizontal strips at the bottom of each column are Z-sections to show apical and basolateral membranes (taken in the plane indicated by the white arrows). After CPZ treatment, basolateral F-actin was selectively decreased but, in contrast, the apical actin signal was increased. The images are representative of three independent experiments. Bar = 10 µm (all panels). (B) AQP2-MDCK cells were treated 15 min with 100 µM CPZ (right panels) or without CPZ (NT, left panels) and then microtubules were visualized using an alpha-tubulin antibody. The larger panels represent confocal sections of the apical (‘) and the middle region (“) of the cell monolayer. The smaller horizontal strips at the bottom of each panel are Z-sections to show apical and basolateral membranes (taken in the plane indicated by the white arrows). After CPZ treatment, the basolateral microtubule (tubulin) signal was increased, but the apical signal was decreased. The images are representative of three independent experiments. Bar = 10 µm (all panels). (C) F-actin quantification assays were performed with or without CPZ treatment. AQP2-MDCK cells were treated with the F-actin depolymerizing drug latrunculin B (LtB, 1 µM for 15 min) or CPZ (100 µM for 15 min) and then were subjected to a rhodamine phalloidin based F-actin quantification assay. A significant 20% reduction in F-actin content was quantified after short-term LtB treatment (to 0.78 ± 0.05 of control levels, mean ± SD, n = 5, p < 0.001). In contrast, F-actin content was slightly but significantly increased after CPZ treatment (to 1.07 ± 0.02 of control levels, mean ± SD, n = 5, p < 0.05).

