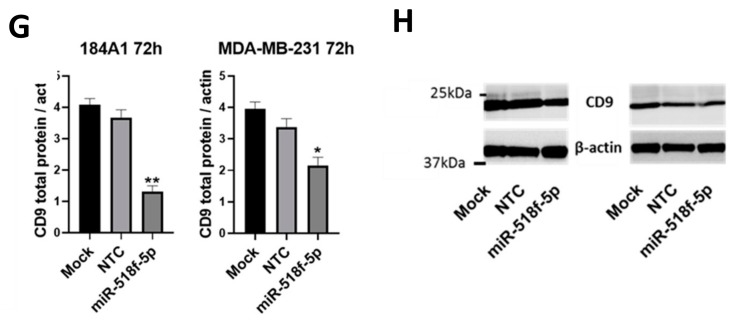
Figure 2.
Transfection of miR-518f-5p mimic increases breast cell migration and decreases CD9 protein levels. (A). Cell migration in 184A1 cells following transfection of a miR-518f-5p mimic assessed using transwell migration assay. (B). Migration of MDA-MB-231 cells following transfection of miR-518f-5p mimic. Migration assay results are shown as fluorescence intensity (arbitrary units), * p = 0.02, ** p = 0.002. (C). Proliferation of 184A1 cells using the resazurin assay, after transfection of miR-518f-5p mimic. (D). MDA-MB-231 proliferation following transfection of a miR-518f-5p mimic, as measured using resazurin assay. Cell proliferation results are shown as fold change fluorescence relative to 24 h fluorescence (arbitrary units). (E). Changes in cell adhesion to basement membrane extract (BME) and fibronectin (FN) were assessed using an adhesion assay, following transfection with miR-518f-5p mimic in 184A1 cells. (F). Cell adhesion was assessed in MDA-MB-231 cells following transfection of miR-518f-5p mimic. Adhesion results are expressed as a ratio of adhesion (fluorescence intensity of adherent cells compared to total seeded cells, arbitrary units), FN: * p = 0.04, BME: * p = 0.01, n = 3. (G). Total CD9 protein expression was measured using SDS-PAGE and western blotting, following transfection of a miR-518f-5p mimic in 184A1 (left) and MDA-MB-231 cells (right) for 72 h. (H). Representative western blots of CD9 total protein expression following transfection with miR-518f-5p mimic for 72 h. Results shown as CD9 total protein normalized to beta actin protein expression, n = 3, * p = 0.04, ** p = 0.001. See Figure S1 for full western blotting images.


