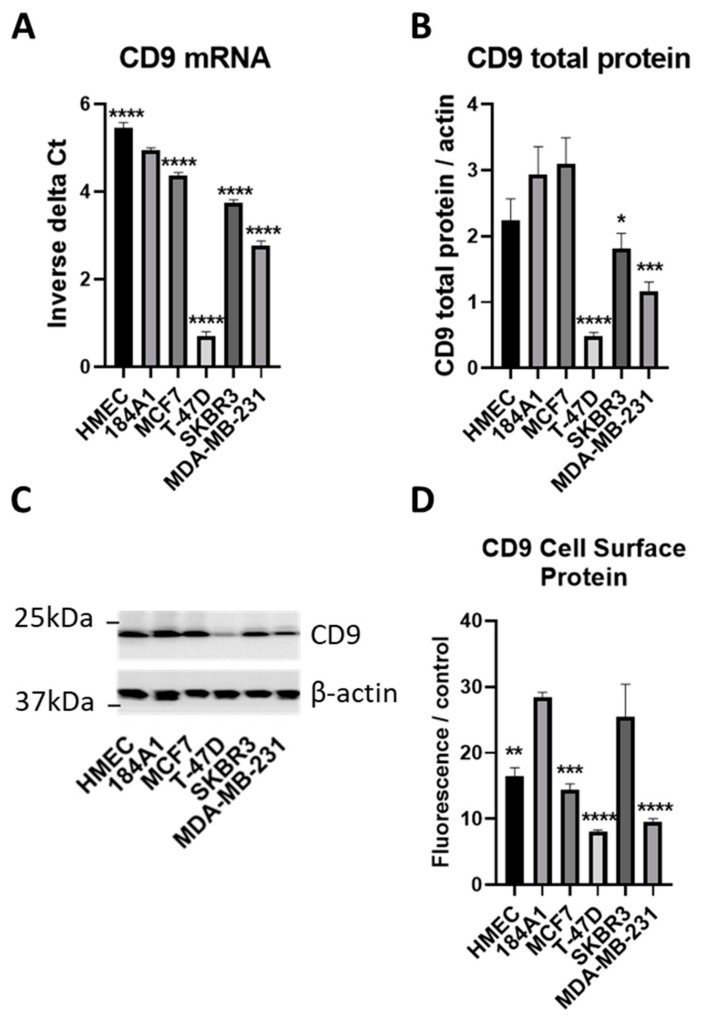
Figure 3.
CD9 expression is decreased in non-tumorigenic and tumorigenic breast cell lines. (A). CD9 mRNA expression was measured using qPCR in a panel of non-tumorigenic and tumorigenic breast cell lines. Results are shown as inverse delta Ct. (B). CD9 total protein expression was assessed using SDS-PAGE and western blotting. Results expressed as CD9 total protein normalized to beta actin expression. (C). Representative western blot of CD9 total protein expression in the panel of breast cell lines. See Figure S2 for full western blotting images. (D). Flow cytometric analysis of CD9 cell surface protein expression in breast cancer cell lines compared to non-tumorigenic breast cells. Results shown as geometric mean fluorescence intensity of CD9 antibody normalized to geometric mean fluorescence intensity of IgG antibody control. n = 3; * p = 0.04, ** p = 0.002, *** p = 0.0008, **** p < 0.0001.

