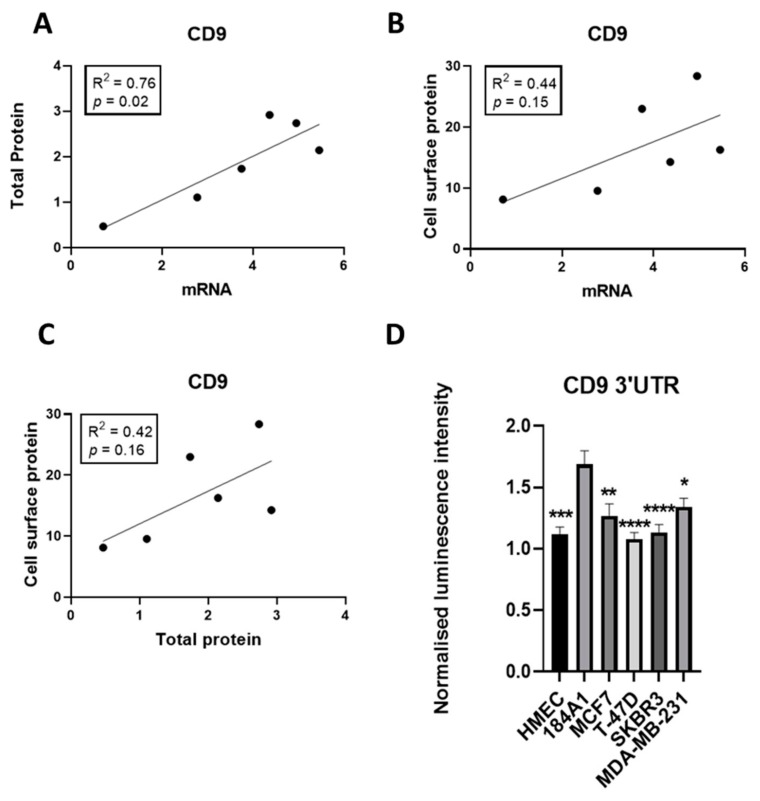
Figure 4.
CD9 mRNA and total protein expression levels positively correlate and there is differential CD9 3′UTR activity in breast cancer cell lines. (A). Linear regression analysis of CD9 mRNA and total protein expression levels across the breast cell line panel. (B). Correlation between CD9 mRNA and CD9 cell surface protein levels as measured using linear regression analysis. (C). Linear regression analysis of CD9 total protein and CD9 cell surface protein expression levels. (D). Endogenous activity of the CD9 3′UTR was measured using a CD9 3′UTR dual luciferase reporter assay in non-tumorigenic and tumorigenic breast cell lines. n = 3; * p = 0.02, ** p = 0.002, *** p = 0.0001, **** p < 0.0001.

