Figure 4.
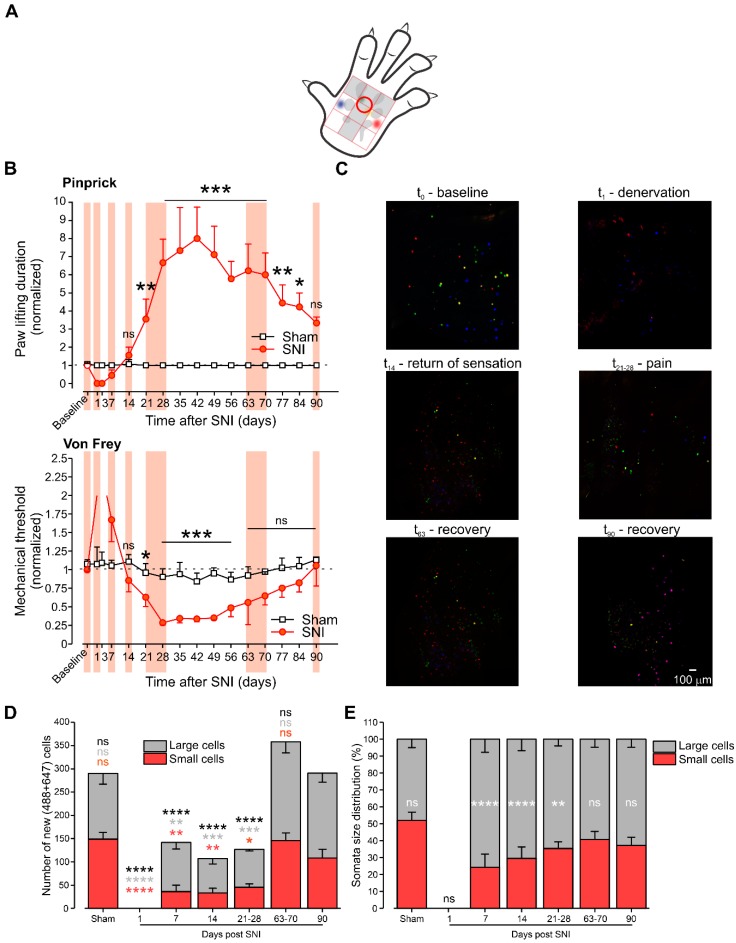
During the development of neuropathic pain symptoms, the skin is reinnervated by a lower number of neurons and primarily by non-nociceptive neurons. (A) Scheme depicting the area (red circle) to which calibrated pinprick and von Frey (VF) were applied to examine the responsiveness of the rats to noxious and innocuous mechanical stimuli, respectively. Note that the chosen area represents the part of the paw skin, which underwent denervation. (B) Changes of the response to pinprick (upper panel) and VF (lower panel) at the indicated times following sham surgery (white squares) and SNI surgery (red circles). The baseline value represents the mean value of the 3 tests performed at three consecutive days before SNI or sham surgery. All of the values were normalized to the baseline value. *** p < 0.001; ** p < 0.01; * p < 0.05; ns—not significant, n = 6 rats in each group, RM two-way ANOVA). Pink vertical areas outline the times at which some of the animals were pulled out of the experiments, and their paws were injected with the AF dyes. These times correspond to the following stages: 1 day after SNI - denervation stage - where no animals responded to the cut off value of the VF (2 X baseline value), and no animals responded to pinprick; seven days after SNI—recovery of sensation in half of the examined animals; 14 days after SNI—return to baseline (recovery of the sensation in all animals); 21–28 days after SNI—development of hyperalgesia and allodynia; 63–70 days after SNI—decrease in hyperalgesia and allodynia; 90 days after SNI—full recovery from hyperalgesia and allodynia. (C) Representative (of six rats) fluorescent photomicrographs of L5 DRGs extirpated 40 h after paw injection of dyes at the indicated times after SNI, corresponding to the abovementioned behavioral stages. (D) Changes in the number of L3-6 DRG somata labeled with either AF488 or AF647 (injected into denervated areas) at the denervation stage (day 1 after SNI), recovery of the sensation stage (7 and 14 days after SNI), development of the hyperalgesia and allodynia stage (21–28 days after SNI); decrease in hyperalgesia and allodynia (63–70 days after SNI) and full recovery from hyperalgesia and allodynia (90 days after SNI), plotted against the number of L3-6 DRG somata labeled with either AF488 or AF647 in animals 90 days after sham surgery. Each bar is composed of the number of small (nociceptive, red) and large (non-nociceptive cells, grey) cells. Comparison is with the number of cells at day 90 after SNI. Black letters and asterisk—comparison between a total number of cells at different time points; red letters and asterisk—comparison between the number of small cells at different time points; grey letters and asterisk—comparison between the number of large cells at different time points. **** p < 0.0001; *** p < 0.001; ** p < 0.01; * p < 0.05; ns—not significant, n = 6 L3-6 DRGs in each group, two-way ANOVA. (E) Bar graph depicting the distribution (in %) of large (grey) and small (red) L3-6 DRG neurons labeled with AF488 or AF647 at the indicated time points and plotted against the L3-6 DRG neurons size distribution from animals 90 days after sham surgery. Comparison is with the number of cells at day 90 after SNI. **** p < 0.0001; ** p < 0.01; ns—not significant, n = 6 L3-6 DRGs in each group, two-way ANOVA, comparisons are between the large and small cells at each time point.

