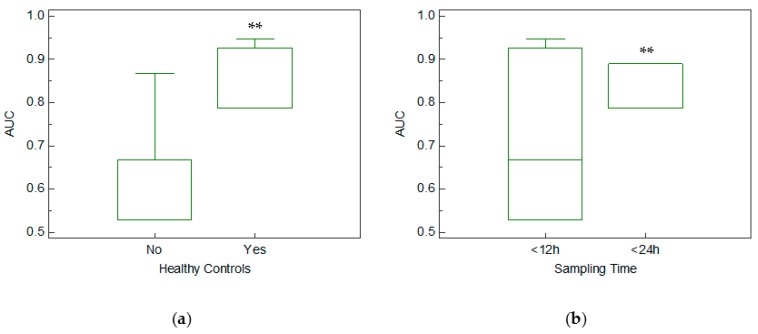
Figure 4.
(a) Boxplot comparing AUC values based on control group characteristics (AUC was 0.89 ± 0.06 and 0.68 ± 0.14 when healthy or unhealthy controls were used, respectively), * p < 0.001. (b) Boxplot comparing AUC values based on sampling time (AUC was 0.82 ± 0.05 and 0.71 ± 0.01 for studies in which samples were acquired within 24 and 12 h, respectively). ** p < 0.001.

