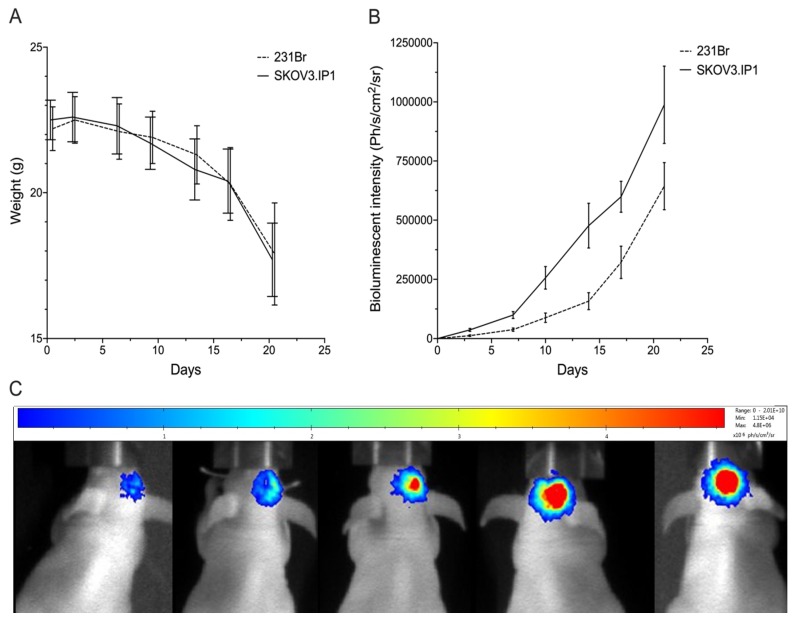
Figure 2.
(A) Follow-up of SKOV3.IP1 an 231Br tumor growth in function of time using body weight measurements, and (B) quantitative (photons/s/cm2/steradian) and (C) visual in vivo bioluminescence imaging at day 3, 7, 10, 14, 17 and 21 post-inoculation (images shown of SKOV3.IP1 tumors and are representative for both tumor models). Values are presented as mean ± SD.

