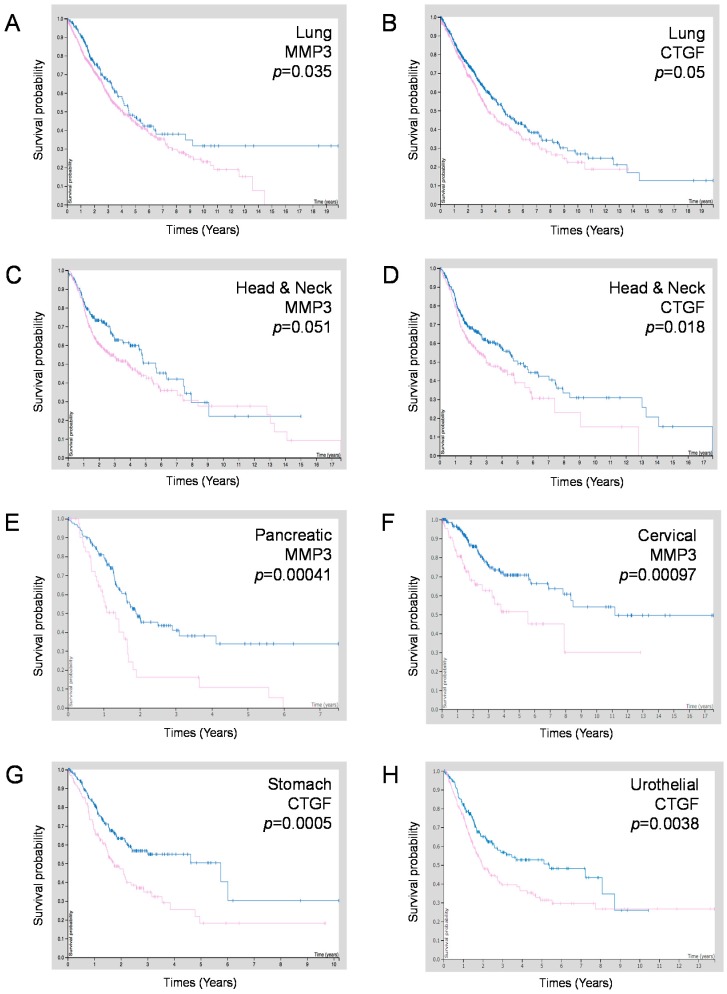
Figure 9.
Kaplan–Meier survival curves of patient groups with MMP3 or CCN2/CTGF high-expression (purple line) vs. low-expression (blue line). (A,B) Head and neck cancer cases. (C,D) lung cancer cases. (E,F) Comparison between MMP3-high vs. -low expression groups in (E) pancreatic cancer cases and (F) cervical cancer cases. (G,H) Comparison between CCN2/CTGF-high vs. -low expression groups in (G) stomach cancer cases and (H) urothelial cancer cases. Data were obtained from TCGA and Human Protein Atlas databases.

