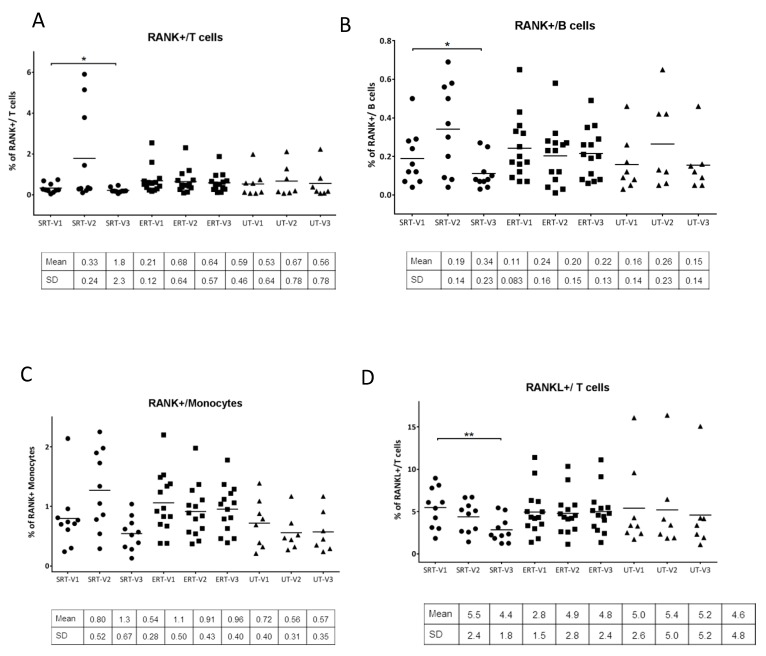
Figure 4.
Analysis of RANK and RANKL on immune cell subsets: Percentage of RANK+ T-lymphocytes (CD45+/CD3+/RANK+), B-lymphocytes (CD45+/CD20+/RANK+) and monocytes (CD45+/CD14+/RANK+) and RANKL+ T-lymphocytes (CD45+/CD3+/RANKL+) at each visit quantitated using flow cytometry analysis from peripheral blood samples at each visit and compared (A-D). Paired student’s t-test was performed to calculate significance values and included in the plots where significant difference was observed. *: p < 0.05; **: p < 0.01. Mean and +/− SD values are noted below individual plots. • SRT cohort; ■ ERT cohort; ▲ UT cohort.

