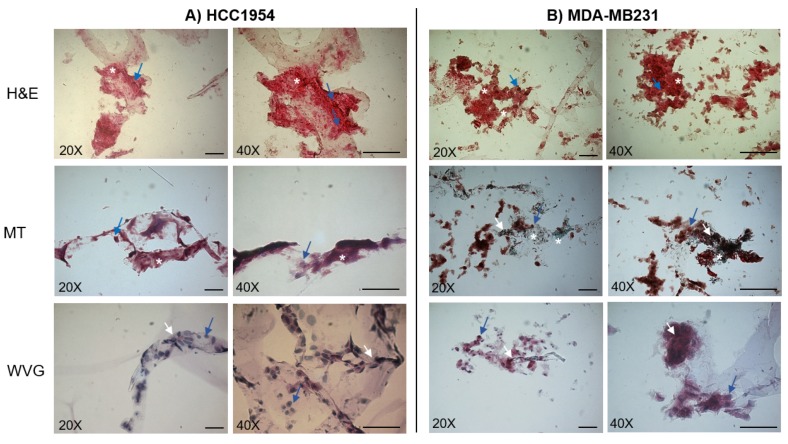
Figure 2.
Histological images of HCC1954 (A) and MDA-MB231 (B) cells cultured in the 3D scaffold for seven days. Representative images acquired by an inverted microscope after staining with Hematoxylin and Eosin (H&E), Masson Trichrome (MT), and Wiegert Van Gieson (WVG) methods. The blue arrows indicate cells, the white stars the extracellular matrix, and the white arrows indicate collagen. Data are from triplicate wells for each condition in two independent experiments. Scale bar 100 µm. Magnification 20× and 40×.

