Figure 5.
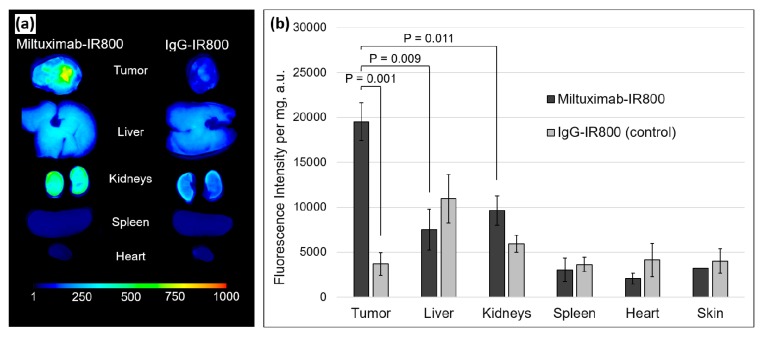
(a) Ex vivo fluorescence imaging of tumor, liver, kidneys, spleen, and heart removed from the mice 10 days after the intravenous injection of Miltuximab®-IR800 (left) or control IgG-IR800 (right). (b) Bar chart of the fluorescence intensity of the homogenized tumors and organs imaged in a 96-well plate. Dark and light gray colors mark Miltuximab®-IR800 and control samples, respectively. Data represent mean fluorescence intensity ± SEM of the samples from three or four independent animals. p values were determined by a Welch’s t test.

