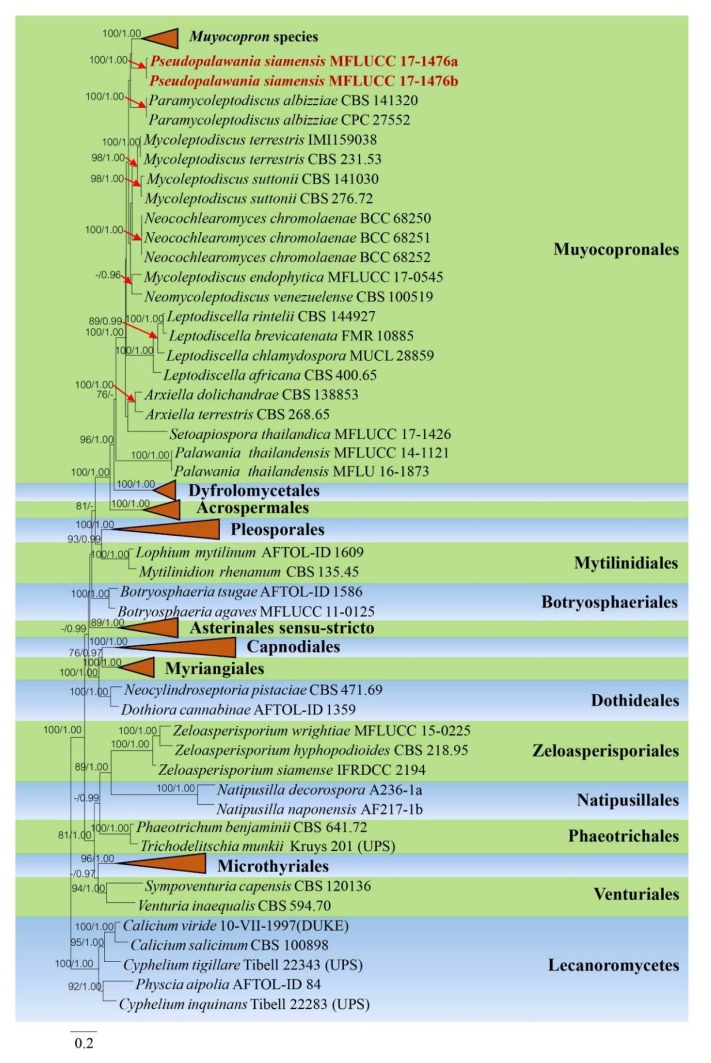
Figure 2.
Phylogram generated from maximum likelihood analysis based on combined dataset of LSU, SSU, RPB2, ITS and TEF sequence data. Bootstrap support values for maximum likelihood (ML) equal to or greater than 60% and Bayesian posterior probabilities (PP) equal to or greater than 0.90 are given above the nodes. Newly generated sequences are in dark red bold. The tree is rooted with Lecanoromycetes. Small red arrows point towards the bootstrap values of the clades representing genera of the order Muyocopronales, while some other monophyletic clades that represent monophyletic clades have been collapses (indicated by red triangles).

