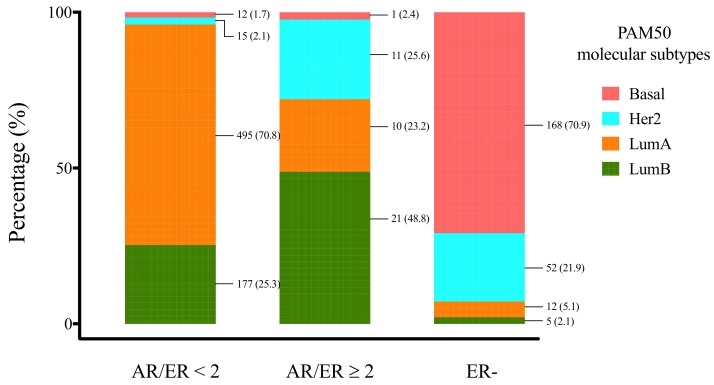
Figure 3.
Molecular subtype distribution of BC cases from GDC, grouped by AR/ER ratio. Cases with ratio AR/ER ≥2 were distributed significantly different respect other groups and are mainly represented by luminal B and HER2-enriched tumors. AR/ER ≥ 2 vs. AR/ER < 2: P < 0.00001*. ER− vs. Other groups: P < 0.00001*. Numbers linked to colours in each bar correspond to total number of cases and its percentage, N (%). ER−: estrogen receptor negative cases. * Chi-Square test (X2).

