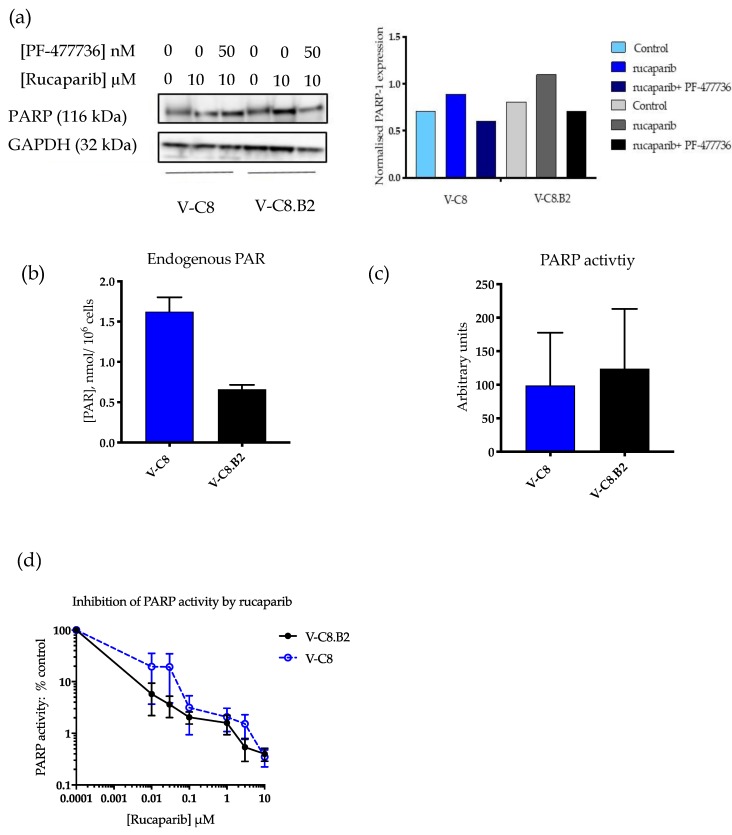
Figure 2.
PARP-1 expression, activity, and inhibition by rucaparib in BRCA2 mutant and corrected cells. (a) V-C8 and V-C8.B2 cells were exposed to drugs at the indicated concentration for 24 h prior to Western blot. Chemiluminescence was quantified using Syngene software. Bar charts are PARP-1 expression relative to the GAPDH loading control. Data are from a single representative experiment. (b) Endogenous PAR was measured in the absence of oligonucleotide and NAD+ by reference to a standard curve. Data are the mean and standard deviation of three independent experiments. (c) PARP activity (mean pixel values) was measured in the presence of oligonucleotide and NAD+. Data are the mean and standard deviation of three individual experiments. (d) PARP activity following exposure to increasing concentrations of rucaparib. Data are the mean and standard error of three individual experiments.

