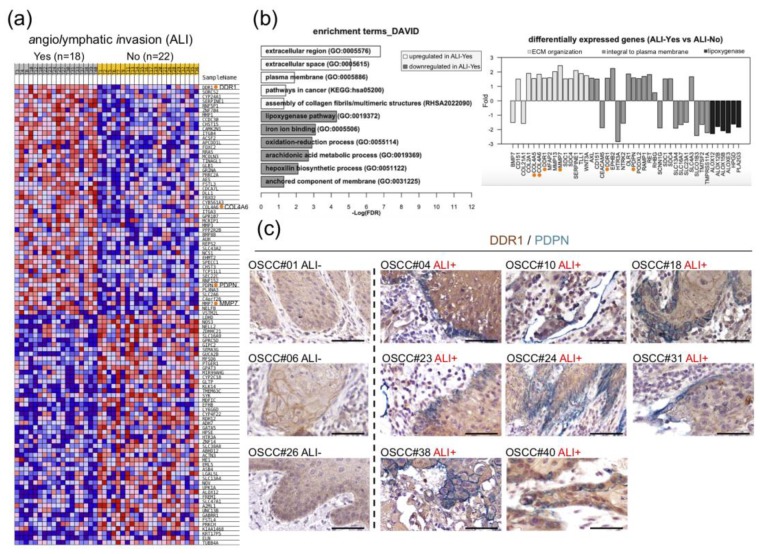
Figure 1.
Upregulation of DDR1 and co-localization of DDR1 and PDPN in the invasion front of OSCC tissues with angiolymphatic invasion (ALI). (a) Heat map shows top 100 genes differentially expressed in ALI-Yes (n = 18) and ALI-No (n = 22). Expression values of high, moderate, low, and lowest are represented as red, pink, light blue, and dark blue, respectively [32]. DDR1, COL4A6, PDPN, and MMP7 are marked with orange dots. (b) Enriched gene ontology terms (left panel, FDR < 0.05) and selected differentially expressed genes (right panel, fold change > 1.5) in ALI. COL4A5, COL4A6, DDR1, MMP7 and PDPN are denoted with orange dots. (c) Representative immunohistochemistry images of OSCC tissues stained for DDR1 (brown) and PDPN (green). Scale bars, 50 μm.

