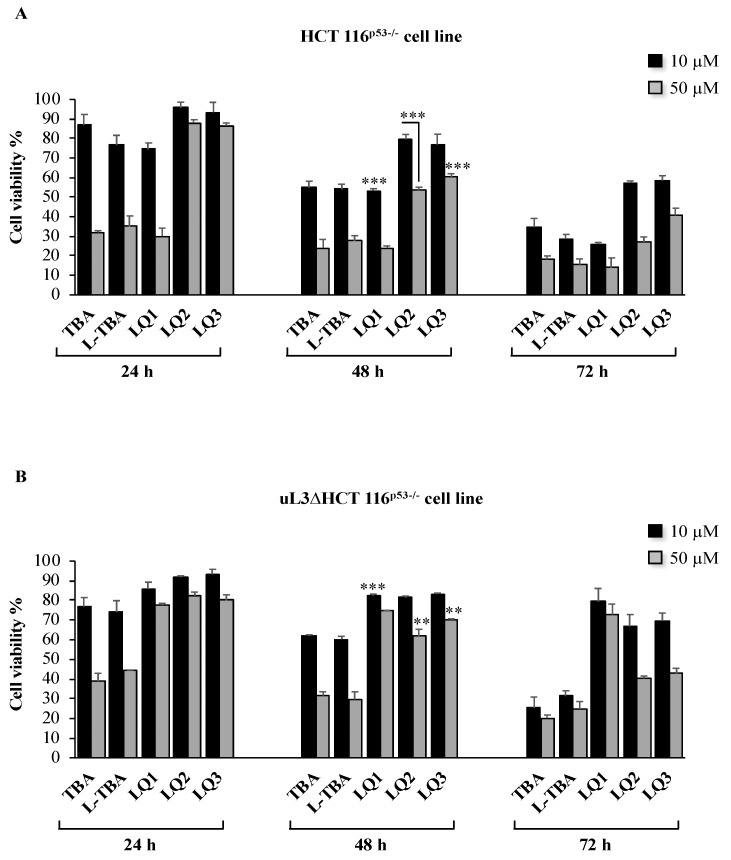
Figure 2.
Cytotoxic activity of L-TBA and its derivatives on HCT 116p53−/− (A) and uL3ΔHCT 116p53−/− (B) cells. Cells have been treated with 10 and 50 μM of ODNs from 24 to 72 h. Cell viability was assayed using the MTT assay. Results are presented as percentage of the untreated cells. Bars represent the mean of triplicate experiments; error bars represent the standard deviation. ** p < 0.01, *** p < 0.001 vs. untreated cells set at 100%.

